
SLIDE 1
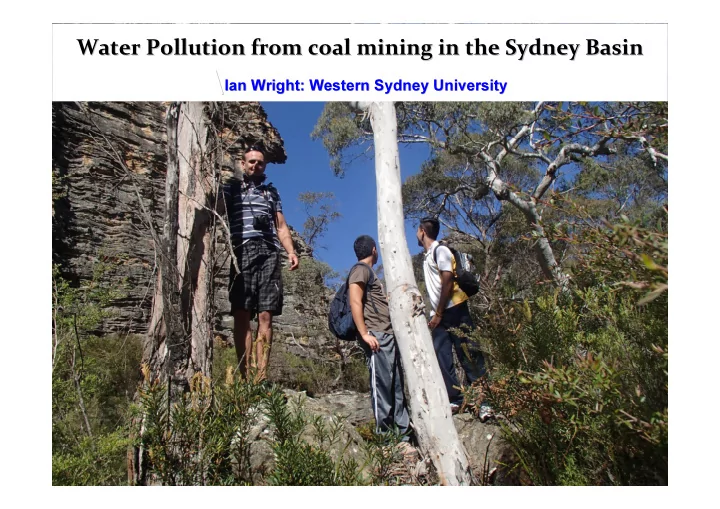
Water Pollution from coal mining in the Sydney Basin Water Pollution from coal mining in the Sydney Basin
\ \Ian Wright: Western Sydney University
Ian Wright: Western Sydney University
\ Ian Wright: Western Sydney University X = coal mine discharge to - - PowerPoint PPT Presentation
Water Pollution from coal mining in the Sydney Basin Water Pollution from coal mining in the Sydney Basin \ Ian Wright: Western Sydney University \ Ian Wright: Western Sydney University X = coal mine discharge to waterway X = coal mine
Ian Wright: Western Sydney University
34º 00‘ S 150º 15‘ E Lake Burragorang Coxs River Grose River Bargo River x West Cliff
Sydney Metro Area
Tahmoor Canyon IM Blue Mountains 60 km
Nepean River
Georges River X Clarence AP SP X X BC X
X X West Cliff Colliery Waste Discharge
X X Tahmoor Colliery Waste Discharge to Bargo River
200 400 600 800 1000 1200 1400 1600 1800
s A P D a w a w S p U S p D W U W D D U D D B U B D G U G D
Mean Electrical Conductivity (uS/cm)
WHA Warragamba Catchment ANZECC salinity trigger values
20 40 60 80 100 120 140 160 180 200
C
s U A P D S a w U S a w D S p U S p D W U W D D U D D B U B D G U G D
Mean sulfate (mg/L)
WHA Warragamba Catchment
3 4 5 6 7 8 9 10
C
s U A P D S a w U S a w S p U S p D W U W D D U D D B U B D G U G D
Mean pH (pH units)
WHA ANZECC Warragamba Catchment
100 200 300 400 500 600
C
s U A P D S a w U S a w D S p U S p D W U W D D U D D B U B D G U G D
Mean bicarbonate (mg/L)
WHA Warragamba Catchment
20 40 60 80 100 120 140 160 180 200
C
s U A P D S a w U S a w D S p U S p D W U W D D U D D B U B D G U G D
Mean Nickel (ug/L)
WHA ANZECC toxicant trigger values Warragamba Catchment
50 100 150 200 250 300 350
C
s U A P D S a w U S a w D S p U S p D W U W D D U D D B U B D G U G D
Mean Zinc (ug/L)
WHA ANZECC toxicant trigger values Warragamba Catchment
50 100 150 200 250 300 350 400 450 WU WD DU DD BU BD GU GD Site Mean Abundance of invertebrates per sample
Wollangambe Dalpura Ck Bargo River Georges River
All coal mine waste water discharges in this study are (or were) regulated through Environment Protection Licences (EPL) which are under NSW Protection of the Environment Operations Act 1997. This is the cover page For ‘The Clarence Colliery’ which ‘dewatered’ into the Wollangambe River.
200 400 600 800 1000 1200 1400 1600 1800 2000 GUS GDS WC Mean concentration (ug/L)
Copper Arsenic Strontium Barium Iron Aluminium Manganese Zinc Nickel
Upstream of mine Downstream of mine Mine Liquid Waste Metal concentrations in the Georges River above (GUS) below (GDS) and West Cliff
The Environment Minister Robyn Parker gave the Environment Protection Authority a stinging rebuke when she heard about the pollution yesterday. “The EPA needs to lift their game “ Ms Parker said. “We’ve put them there, And given them increased powers, and increased responsibilities, and I need To see some action from them”. (Ben Cubby, Sydney Morning Herald, 18/7/12)
200 400 600 800 1000 1200 1400 Rita / RB1 RB2 RB3 Bargo us Bargo ds Electrical conductivity (µS/cm)
Longwall Mine below Creek Tahmoor Coal Mine
10 20 30 40 50 60 70 80 RB1 RB2 RB3 BUS BDS % Culicidae
receiving streams: comparison of impacts from an active mine with a closed mine. Submitted to Water, Air and Soil Pollution.
macroinvertebrates: importance of taxonomic resolution, water geochemistry and EPT indices for impact detection. Submitted to Hydrobiologia.
mine and mine wastewater discharge causing water pollution and degradation of aquatic ecosystems. Water, Air and Soil Pollution. 236-348.
system in NSW: the case of water pollution. Environmental Planning and Law Journal. 29: 359-372.
a pristine upland catchment. Hydrobiologia 635: 15-25.
macroinvertebrates within an otherwise clean upland catchment, south-eastern Australia. Water, Air and Soil Pollution. 204: 227-241.
wastes on water quality and aquatic ecosystems using freshwater macroinvertebrate communities and novel bio-assay tests, in Viets, G; Rutherfurd, I.D, and Hughes, R. (editors), Proceedings of the 7th Australian Stream Management Conference, Townsville, Queensland, Pages 369-376.
water quality and aquatic ecosystems in the Blue Mountains World Heritage Area, in Viets, G; Rutherfurd, I.D, and Hughes, R. (editors), Proceedings of the 7th Australian Stream Management Conference, Townsville, Queensland, Pages 385-391.
growing headache for water pollution regulators. In Grove, J.R. and Rutherfurd, I.D (eds). Proceedings of the 6th Australian Stream Management Conference, Managing for Extremes, 6-8 February, 2012 Canberra, Australia, published by the River Basin Management Society p.p 206-213.