
SLIDE 1
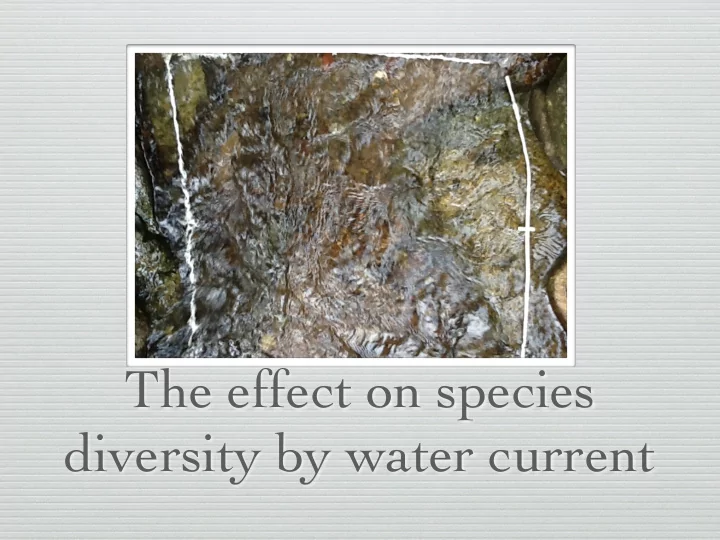
The effect on species diversity by water current Controlled - - PowerPoint PPT Presentation
The effect on species diversity by water current Controlled Variables Water depth River bed substrate composition Light intensity Abundance of water plants Temperature Dependent variable Animal species Ind Rate of water flow Hypothesis
Water depth River bed substrate composition Light intensity Abundance of water plants Temperature
Animal species
Rate of water flow
Current has direct effect on the distribution of
related to the speed of the water current
surfaces
flow
catch by using forceps flowing with the water current.
river bed substrate, light intensity, temperature and abundance of water plants.
rate at the shallow and stony part of the stream where we did animal survey. Make a few measurements at different points and then take average of the readings.
species.
1mm to 2cm
nymph, bloodworm, water penny
Caddisfly larva attached to the rock surfaces
1mm to 5cm
stream snoil, Toby
are present in both high and low water current.
greater in size are present in lower water current, while absent in greater water current.
greater fluid resistance. It may be more difficult for them to maintain stability.
shells to protect them from high pressure.
current
the species perhaps due to malnutrition and instability
possibilities to survive in malevolence per