
SLIDE 1
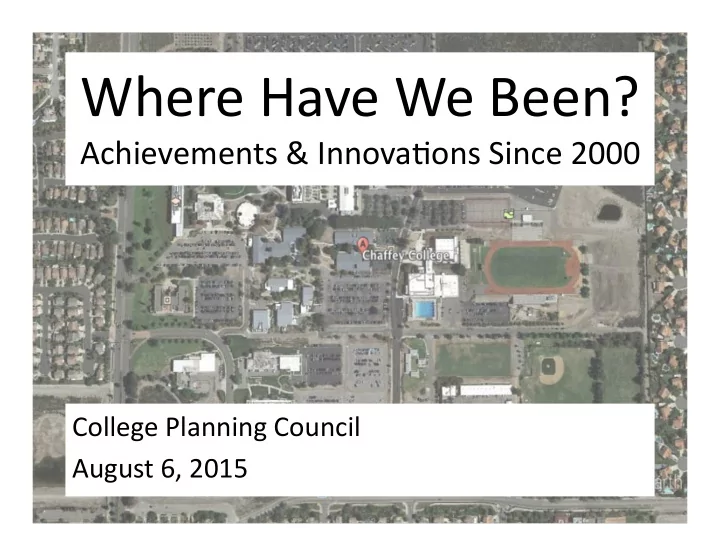
Where ¡Have ¡We ¡Been? ¡
Achievements ¡& ¡Innova5ons ¡Since ¡2000 ¡
College ¡Planning ¡Council ¡ August ¡6, ¡2015 ¡
Where do you think we have been? Write 3 ways that - - PowerPoint PPT Presentation
Where Have We Been? Achievements & Innova5ons Since 2000 College Planning Council August 6, 2015 Where do you think we have been? Write 3
College ¡Planning ¡Council ¡ August ¡6, ¡2015 ¡
has ¡changed ¡or ¡improved ¡since ¡you ¡first ¡ arrived ¡here. ¡
your ¡role ¡ students ¡ departmental ¡ college-‑wide ¡
16,870 ¡ 18,537 ¡ 19,984 ¡ 18,438 ¡ 18,845 ¡ 18,082 ¡ 18,824 ¡ 19,751 ¡ 20,481 ¡ 21,552 ¡ 19,771 ¡ 19,432 ¡ 18,420 ¡ 19,945 ¡ 20,226 ¡
0 ¡ 5,000 ¡ 10,000 ¡ 15,000 ¡ 20,000 ¡ 25,000 ¡ Unduplicated ¡Student ¡Headcount ¡
14% ¡ 6% ¡ 36% ¡ 2% ¡ 38% ¡ 4% ¡
2000-‑01 ¡
8% ¡ 6% ¡ 18% ¡ 4% ¡ 61% ¡ 3% ¡
2014-‑15 ¡
African ¡American ¡ Other ¡Ethnicity ¡ Asian/Pacific ¡Islander ¡ Hispanic ¡ Caucasian ¡ Unknown/Decline ¡to ¡State ¡
Chaffey ¡College, ¡Rancho ¡Campus, ¡September ¡2003 ¡
Chaffey ¡College, ¡Rancho ¡Campus, ¡April ¡2014 ¡
¡ ¡ ¡ ¡ ¡2000 ¡ ¡
¡ ¡ ¡2007 ¡& ¡2011 ¡
¡ ¡ ¡ ¡2007 ¡
¡ ¡ ¡ ¡2008 ¡
¡ ¡ ¡ ¡2008 ¡
¡ ¡ ¡ ¡ ¡2014 ¡
60.7 ¡ 61.0 ¡ 62.1 ¡ 63.1 ¡ 63.6 ¡ 62.8 ¡ 63.6 ¡ 64.8 ¡ 66.1 ¡ 68.8 ¡ 70.6 ¡ 71.5 ¡ 71.7 ¡ 71.3 ¡ 71.7 ¡
54.0 ¡ 56.0 ¡ 58.0 ¡ 60.0 ¡ 62.0 ¡ 64.0 ¡ 66.0 ¡ 68.0 ¡ 70.0 ¡ 72.0 ¡ 74.0 ¡ Course ¡Success ¡Rate ¡
76.9 ¡ 77.7 ¡ 79.3 ¡ 80.7 ¡ 84.5 ¡ 84.7 ¡ 85.8 ¡ 86.4 ¡ 86.7 ¡ 87.9 ¡ 88.4 ¡ 90.7 ¡ 90.0 ¡ 90.8 ¡ 91.7 ¡
65.0 ¡ 70.0 ¡ 75.0 ¡ 80.0 ¡ 85.0 ¡ 90.0 ¡ 95.0 ¡ Course ¡Reten5on ¡Rate ¡
Race/Ethnicity ¡ 2000-‑01 ¡ 2004-‑05 ¡ 2009-‑10 ¡ 2014-‑15 ¡
African ¡American ¡ 52.6 ¡ 58.5 ¡ 61.9 ¡ 65.9 ¡ Asian ¡ 65.2 ¡ 72.9 ¡ 77.5 ¡ 80.1 ¡ Caucasian ¡ 66.5 ¡ 68.3 ¡ 73.1 ¡ 77.8 ¡ Hispanic ¡ 57.4 ¡ 60.6 ¡ 66.7 ¡ 69.9 ¡ Na5ve ¡American ¡ 59.4 ¡ 50.7 ¡ 66.1 ¡ 70.2 ¡ Pacific ¡Islander ¡ 54.0 ¡ 61.8 ¡ 64.5 ¡ 62.3 ¡ Mul5-‑Racial/Ethnic ¡ 56.0 ¡ 62.9 ¡ 65.3 ¡ 69.9 ¡ Unknown ¡ 61.7 ¡ 68.4 ¡ 70.7 ¡ 72.2 ¡ TOTAL ¡ 60.7 ¡ 63.6 ¡ 68.8 ¡ 71.7 ¡
Race/Ethnicity ¡ 2000-‑01 ¡ 2004-‑05 ¡ 2009-‑10 ¡ 2014-‑15 ¡
African ¡American ¡ 72.6 ¡ 82.6 ¡ 86.6 ¡ 90.9 ¡ Asian ¡ 79.8 ¡ 88.0 ¡ 90.1 ¡ 93.4 ¡ Caucasian ¡ 79.1 ¡ 85.3 ¡ 89.1 ¡ 92.2 ¡ Hispanic ¡ 76.0 ¡ 84.0 ¡ 87.2 ¡ 91.5 ¡ Na5ve ¡American ¡ 75.5 ¡ 78.0 ¡ 85.3 ¡ 87.8 ¡ Pacific ¡Islander ¡ 72.2 ¡ 86.2 ¡ 82.7 ¡ 90.2 ¡ Mul5-‑Racial/Ethnic ¡ 73.7 ¡ 82.9 ¡ 86.4 ¡ 91.1 ¡ Unknown ¡ 77.0 ¡ 87.3 ¡ 88.7 ¡ 91.6 ¡ TOTAL ¡ 76.9 ¡ 84.5 ¡ 87.9 ¡ 91.7 ¡
¡ ¡ ¡ ¡ ¡2008 ¡
¡ ¡ ¡ ¡2011 ¡
¡ ¡ ¡2011 ¡
¡ ¡ ¡2011 ¡
¡ ¡2013 ¡
¡ ¡2013 ¡
¡ ¡ ¡ ¡ ¡ ¡ongoing ¡
1,497 ¡ 1,625 ¡ 1,737 ¡ 2,052 ¡ 1,851 ¡ 1,694 ¡ 2,033 ¡ 2,162 ¡ 2,291 ¡ 2,265 ¡ 2,306 ¡ 2,869 ¡ 3,123 ¡ 3,280 ¡ 3,473 ¡
0 ¡ 500 ¡ 1,000 ¡ 1,500 ¡ 2,000 ¡ 2,500 ¡ 3,000 ¡ 3,500 ¡ 4,000 ¡ Degrees ¡& ¡Cer5ficates ¡Awarded ¡
Race/Ethnicity ¡ 2000-‑01 ¡ 2004-‑05 ¡ 2009-‑10 ¡ 2014-‑15 ¡
African ¡American ¡ ¡ ¡9.6 ¡ ¡ ¡8.0 ¡ ¡ ¡9.0 ¡ ¡ ¡8.8 ¡ Asian ¡ ¡ ¡8.8 ¡ ¡ ¡8.4 ¡ ¡ ¡6.6 ¡ ¡ ¡7.3 ¡ Caucasian ¡ 39.3 ¡ 34.3 ¡ 29.1 ¡ 24.1 ¡ Hispanic ¡ 32.1 ¡ 37.3 ¡ 39.7 ¡ 53.4 ¡ Na5ve ¡American ¡ ¡ ¡0.3 ¡ ¡ ¡0.6 ¡ ¡ ¡0.4 ¡ ¡ ¡0.5 ¡ Pacific ¡Islander ¡ ¡ ¡0.5 ¡ ¡ ¡0.4 ¡ ¡ ¡0.2 ¡ ¡ ¡0.3 ¡ Other ¡ ¡ ¡5.2 ¡ ¡ ¡5.0 ¡ ¡ ¡4.5 ¡ ¡ ¡2.7 ¡ Unknown ¡ ¡ ¡4.2 ¡ ¡ ¡5.9 ¡ 10.4 ¡ ¡ ¡2.9 ¡ TOTAL ¡ 100.0 ¡ 100.0 ¡ 100.0 ¡ 100.0 ¡
waitlists ¡ add ¡& ¡drop ¡deadlines ¡
the ¡majority ¡of ¡current ¡full-‑5me ¡faculty ¡were ¡hired ¡since ¡ 2000 ¡
data ¡and ¡informa5on ¡above. ¡