SLIDE 1
Kádár & Gede: Where do tourists go? – ICC 2013 Dresden, 2012.08.25–30 – 1/15
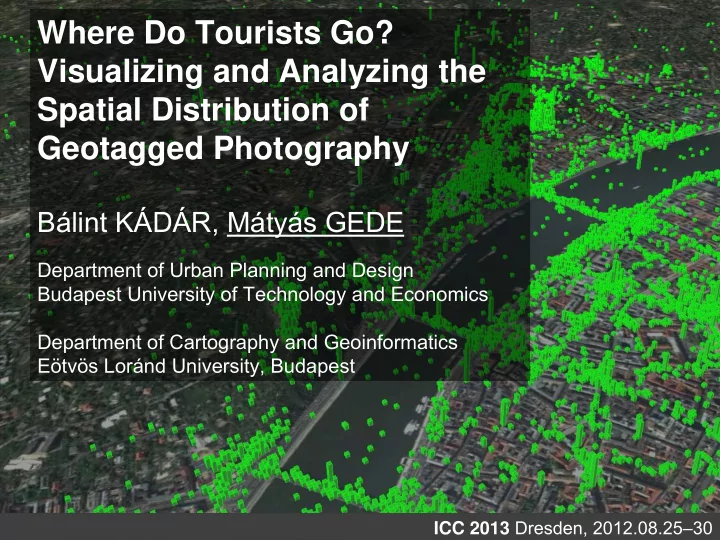
Where Do Tourists Go? Visualizing and Analyzing the Spatial Distribution of Geotagged Photography
Bálint KÁDÁR, Mátyás GEDE
Department of Urban Planning and Design Budapest University of Technology and Economics Department of Cartography and Geoinformatics Eötvös Loránd University, Budapest
ICC 2013 Dresden, 2012.08.25–30
SLIDE 2 Kádár & Gede: Where do tourists go? – ICC 2013 Dresden, 2012.08.25–30 – 2/15
Outline
- Aims
- But what makes a photo „geotagged”?
- Data collecting through photo sharing APIs
- Visualization, analysis
- Discussion
- Further possibilities
SLIDE 3 Kádár & Gede: Where do tourists go? – ICC 2013 Dresden, 2012.08.25–30 – 3/15
Aims:
Collecting and analyzing information from geotagged photos for…
- Providing information about tourists’
spatial distribution in cities based on geotagged photography
- Analyzing the behavior of short-term and longer staying
visitors
- Verifying the impact of urban developments
SLIDE 4 Kádár & Gede: Where do tourists go? – ICC 2013 Dresden, 2012.08.25–30 – 4/15
But what makes a photo „geotagged”?
Geotag = geographic positional information Sources of position data:
- Cameras with GPS device
- Smartphones (using GPS / WiFi / GSM position info)
- Separate GPS device, geotags are merged into images
using a special SW
- Geotagging while uploading photos to photo-sharing
sites Geotagging is popular: more than 25000 photos at Budapest in one year (on Flickr)
SLIDE 5 Kádár & Gede: Where do tourists go? – ICC 2013 Dresden, 2012.08.25–30 – 5/15
Data collecting through photo sharing APIs
Some services provide an API (Application Programming Interface)
- perating via HTTP requests
- providing attributes of photos taken within a given quadrangle
(specified by boundary latitudes/longitudes)
- limited amount of data per request (e.g. max 250 photos at Flickr)
Due to the limitations it is advisable to store the data in a database for further analysis
data collector application
background DB
photo sharing API
request response photo data
SLIDE 6
Kádár & Gede: Where do tourists go? – ICC 2013 Dresden, 2012.08.25–30 – 6/15
Flickr vs. Panoramio
Panoramio no registration undocumented filtering -> contradictory results Flickr requires registration (free of charge) downloaded data more reliable
SLIDE 7
Kádár & Gede: Where do tourists go? – ICC 2013 Dresden, 2012.08.25–30 – 7/15
Visualization #1: raw data
Let’s place a dot at each photo’s location!
SLIDE 8 Kádár & Gede: Where do tourists go? – ICC 2013 Dresden, 2012.08.25–30 – 8/15
Analyzing data
useful attributes:
- location
- date of photo
- owner ID
Example: if the date difference of a user’s first and last photo within a given area is greater than 5 days, the user can be considered as a local it that area. Otherwise, the user is a visitor there.
Results (at Budapest):
Most visitor photos are concentrated around touristic highlights (Castle Hill, Danube Bank and bridges, Par- lament, St. Stephen’s Basilica, And- rássy Avenue, Heroe’s Square etc.) Local photos also include touristic highlights, but there are several pictures scattered at residential areas and large number of photos at pubs, sport fields / stadiums, universities etc.
SLIDE 9 Kádár & Gede: Where do tourists go? – ICC 2013 Dresden, 2012.08.25–30 – 9/15
Visualization #2: 3D bars
Let’s place a grid to the map of the examined area and calculate the number
- f photos in each grid cell. The results can be visualized as 3D
bars on a digital globe (e.g. in Google Earth).
SLIDE 10
Kádár & Gede: Where do tourists go? – ICC 2013 Dresden, 2012.08.25–30 – 10/15
Visualization #2: 3D bars
Changing tourist timespan limit
SLIDE 11
Kádár & Gede: Where do tourists go? – ICC 2013 Dresden, 2012.08.25–30 – 11/15
Visualization #2: 3D bars
Differences of local/tourist pattern and impact of new developments
SLIDE 12 Kádár & Gede: Where do tourists go? – ICC 2013 Dresden, 2012.08.25–30 – 12/15
Visualization #3: Difference map
Difference maps showing whether the local
photos are in majority, or their number is similar. The grid cell size is doubled on the right-side map to demonstrate the importance of grid granularity.
SLIDE 13 Kádár & Gede: Where do tourists go? – ICC 2013 Dresden, 2012.08.25–30 – 13/15
Discussion
Number of days instead of total timespan:
- ~17% difference
- repeated visitors tend to act like locals
User count instead of photo count:
- correlates more to the number of visitors
- correlates less to the atractiveness of the place
Grid size: 10m*10m
- more or less equals to GPS position error
- smaller than urban features (houses, places etc.)
→ photos within a cell are at the same place
SLIDE 14 Kádár & Gede: Where do tourists go? – ICC 2013 Dresden, 2012.08.25–30 – 14/15
Further possibilities
- temporal analysis:
- photo distribution before and after a specific
urban development (e.g. a new pedestrian zone)
- comparing photos taken in summer/winter,
working days/weekends, morning/afternoon etc.
- movement analysis: generating typical tourist paths
- developing
additional visualization methods together with the above mentioned analysis.
- defining a „touristic graph”
- f a city by automated spatial
clustering of photos
SLIDE 15
Kádár & Gede: Where do tourists go? – ICC 2013 Dresden, 2012.08.25–30 – 15/15
Thank you for your attention!