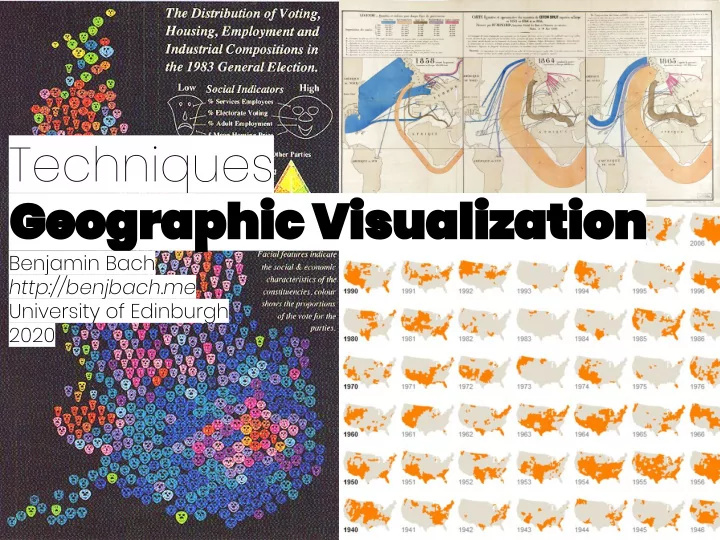
Outline - Tasks - Map projections - Visualizing area data - - - PowerPoint PPT Presentation

outline
SMART_READER_LITE
LIVE PREVIEW

Outline - Tasks - Map projections - Visualizing area data - - - PowerPoint PPT Presentation

Outline - Tasks - Map projections - Visualizing area data - Visualizing point data - Visualizing trajectories - Visualizing time Tasks Locations (0D, Points) Areas (2D) Distribution Comparison Sensity Max/min values


slide-1
SLIDE 1
slide-2
SLIDE 2

Outline

  • Tasks
  • Map projections
  • Visualizing area data
  • Visualizing point data
  • Visualizing trajectories
  • Visualizing time
slide-3
SLIDE 3

Tasks

  • Locations (0D, Points)

○ Distribution ○ Sensity ○ Values ○ Distances ○ Temporality

  • Trajectories (1D, lines)

○ Locations ○ Common paths ○ Directionality ○ Temporality

  • Areas (2D)

○ Comparison ○ Max/min values ○ Geographic areas +

trends and outliers ○ temporality

slide-4
SLIDE 4

Map Projections

slide-5
SLIDE 5

The True Size Of...

https://thetruesize.com/

slide-6
SLIDE 6

Projections: Trajectories

Direct flight: London-Sydney

slide-7
SLIDE 7

The True Size of Africa

slide-8
SLIDE 8

Merkator Projection

slide-9
SLIDE 9

Area preserving projections

Lambert: Hobo-Dyer

slide-10
SLIDE 10

Trade-offs

Goode Homolosine Ginzburgh IV

slide-11
SLIDE 11

Projections

  • Preserve: shape, area, or angle, distance, direction
  • Any projection can only preserve 1-2, not more
  • > Tradeoff

Merkator Ginzburgh IV

Preserves shape Preserves area

Hobo-Dyer

slide-12
SLIDE 12

Local projections: Conic Conformal

slide-13
SLIDE 13

Alternative Projections: Ocean centric

slide-14
SLIDE 14

https://medium.com/nightingale/a-little-help-from-my-friends-a-look-inside- the-data-visualization-society-map-of-global-ab5547149fe9

Land centric

slide-15
SLIDE 15

More projections

https://www.win.tue.nl/~vanwijk/myriahedr al/geo_aligned_maps.png

slide-16
SLIDE 16

More projections...

https://github.com/d3/d3-geo-projection https://github.com/d3/d3-geo

slide-17
SLIDE 17

https://www.jasondavies.com/maps/transition/

slide-18
SLIDE 18

Area Data

slide-19
SLIDE 19

Most intuitive ... most harmful

Choropleth maps

  • Work well when comparing total

surfaces

  • Don't work well when showing data

with different densities per area:

  • Overemphasize large areas
  • Hide small areas
  • Overemphasize areas with low

data-densities

  • Underemphasize areas with high

data-densities.

slide-20
SLIDE 20

Choropleth alternatives Dot-maps:

  • Each area becomes dot
  • Map shows area density

as well as

  • values

"Bar-maps":

slide-21
SLIDE 21

Choropleth alternatives: Distortions

slide-22
SLIDE 22

Choropleth alternatives: Distortions

slide-23
SLIDE 23

Choropleth alternatives Equal Areas + Glyphs

http://datavizcatalogue.com/blog/chart-combinations-tile-grid-maps/

slide-24
SLIDE 24

Multivariate map data: Glyphs

http://datavizcatalogue.com/blog/chart-combinations-tile-grid-maps/

slide-25
SLIDE 25

Chernoff Faces

slide-26
SLIDE 26

Chernoff Faces

+ Individual values + Spatial correlation

  • Some vis-variables are more

prominent

  • Some vis-variables are hard to

perceive and estimate

slide-27
SLIDE 27

Small Multiples

slide-28
SLIDE 28

Point Data

slide-29
SLIDE 29

Point map

slide-30
SLIDE 30

Heat maps

slide-31
SLIDE 31

Elevation map

+ Can show huge differences in values + Allows for comparison

  • Geographic distortion
  • Possible occlusion
slide-32
SLIDE 32

Binning

slide-33
SLIDE 33

Trajectories

slide-34
SLIDE 34

Charles Joseph Minard (1781-1870)

slide-35
SLIDE 35

Flow Diagram

slide-36
SLIDE 36

Encoding information

https://medium.com/the-data-experience/bicycles-in-th e-city-f9529d918388

Wood, Jo. "Visualizing personal progress in participatory sports cycling events." IEEE Computer Graphics and Applications 35.4 (2015): 73-81.

slide-37
SLIDE 37

Texture

Bertin, Jacques. Semiology of graphics; diagrams networks maps. No. 04; QA90, B7.. 1983.

slide-38
SLIDE 38

Time steps / velocity

Bertin, Jacques. Semiology of graphics; diagrams networks maps. No. 04; QA90, B7.. 1983.

Columbus journeys to the Americas

slide-39
SLIDE 39

Animation: animating particles

Romat, Hugo, et al. "Animated edge textures in node-link diagrams: A design space and initial evaluation." Proceedings of the 2018 CHI Conference on Human Factors in Computing Systems. 2018.

http://ilda.saclay.inria.fr/flownet/

slide-40
SLIDE 40

Visits

slide-41
SLIDE 41

Space-Time Cubes

Bach, Benjamin, et al. "A Descriptive Framework for Temporal Data Visualizations Based on Generalized Space‐Time Cubes." Computer Graphics Forum. Vol. 36. No. 6. 2017.

slide-42
SLIDE 42

Tominski, Christian, et al. "Stacking-based visualization of trajectory attribute data." IEEE Transactions on visualization and Computer Graphics 18.12 (2012): 2565-2574.

slide-43
SLIDE 43

Time

slide-44
SLIDE 44

Small Multiples

slide-45
SLIDE 45

+ Compare regions + Look-up regions + Details on regions

  • Occlusion
slide-46
SLIDE 46

Geo-flow

+ Compare regions + Look-up regions + Details on regions

  • Compare far away glyphs
  • Glyphs can become small
slide-47
SLIDE 47

https://vita.had.c

  • .nz/papers/gly

ph-maps.pdf

Glyph Maps

slide-48
SLIDE 48

Further reading

  • Alberto Cairo: The Truthful Art: Chapter 10: Mapping Data
  • Bertin, Jacques. Semiology of graphics; diagrams networks
  • maps. No. 04; QA90, B7.. 1983.
  • Andrienko, Gennady, et al. "Space, time and visual analytics."

International journal of geographical information science 24.10 (2010): 1577-1600.

  • Andrienko, Natalia, and Gennady Andrienko. Exploratory

analysis of spatial and temporal data: a systematic approach. Springer Science & Business Media, 2006.

  • Bach, Benjamin, et al. "A descriptive framework for temporal

data visualizations based on generalized space‐time cubes." Computer Graphics Forum. Vol. 36. No. 6. 2017.

  • Bach, Benjamin, et al. "Ways of Visualizing Data on Curves."

2018.