
SLIDE 1
1
Visualizing Heart Data Visualizing Heart Data from Pulse Intervals from Pulse Intervals
By By Juan Gabriel Estrada Alvarez Juan Gabriel Estrada Alvarez
What do researchers seek? What do researchers seek?
- To achieve a better understanding of the state
To achieve a better understanding of the state
- f a living entity by analyzing time
- f a living entity by analyzing time-
- series data
series data taken from blood pressure taken from blood pressure
- Tools exist (e.g. Spectral analysis, Wavelet,
Tools exist (e.g. Spectral analysis, Wavelet, etc.) etc.)
- These tools are nonetheless hard to interpret:
These tools are nonetheless hard to interpret:
– – The high irregularity in the data set causes The high irregularity in the data set causes “ “noise noise” ” to show up, possibly hiding the juicy stuff to show up, possibly hiding the juicy stuff
Typical Spectrum Typical Spectrum
- Clearly it is not so simple to infer things from
Clearly it is not so simple to infer things from something that looks like this: something that looks like this:
What do researchers want? What do researchers want?
- To be able to look at the data in a way that
To be able to look at the data in a way that is easier to interpret is easier to interpret
- To have a means of classification of heart
To have a means of classification of heart data based on the state of the data based on the state of the ‘ ‘patient patient’ ’
- As a consequence, diagnosis would become
As a consequence, diagnosis would become easier, and diseases might be prevented by easier, and diseases might be prevented by early detection early detection
The Proposed Solution The Proposed Solution
- Clustering on the (derived) pulse
Clustering on the (derived) pulse interval data as an attempt to classify; interval data as an attempt to classify;
- A
A TimeSearcher TimeSearcher-
- like application to visualize the
like application to visualize the data; data;
- Query boxes would be useful in examining
Query boxes would be useful in examining common features across clusters; common features across clusters;
- Zoom boxes would allow detailed examination
Zoom boxes would allow detailed examination
- f individual time
- f individual time-
- series.
series.
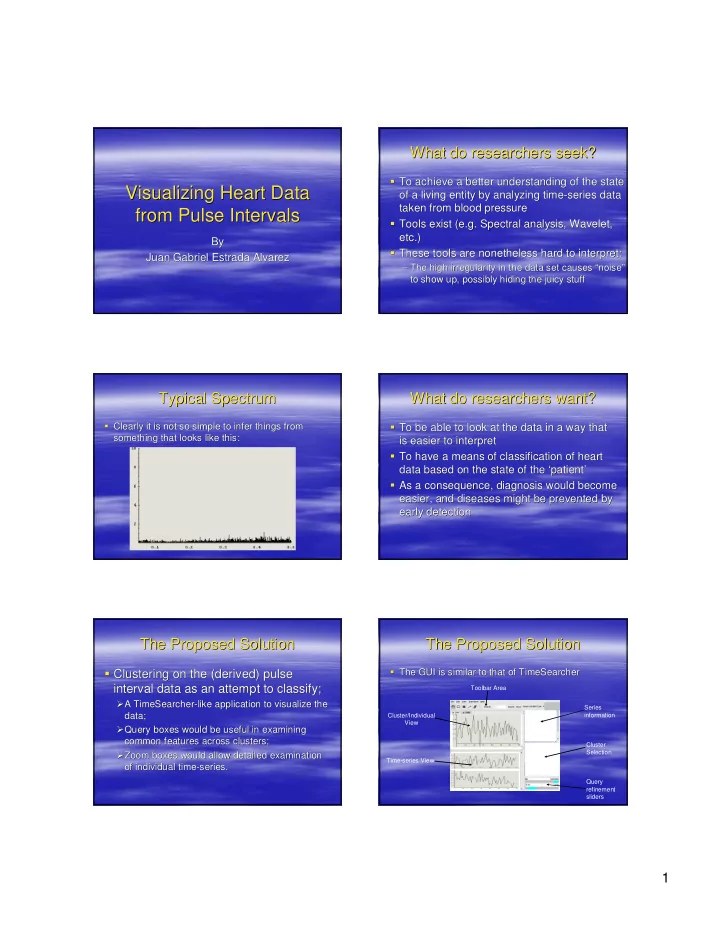
The Proposed Solution The Proposed Solution
- The GUI is similar to that of
The GUI is similar to that of TimeSearcher TimeSearcher
Cluster/Individual View Time-series View Cluster Selection Query refinement sliders Toolbar Area Series information