
SLIDE 1
What do hidden representations learn?
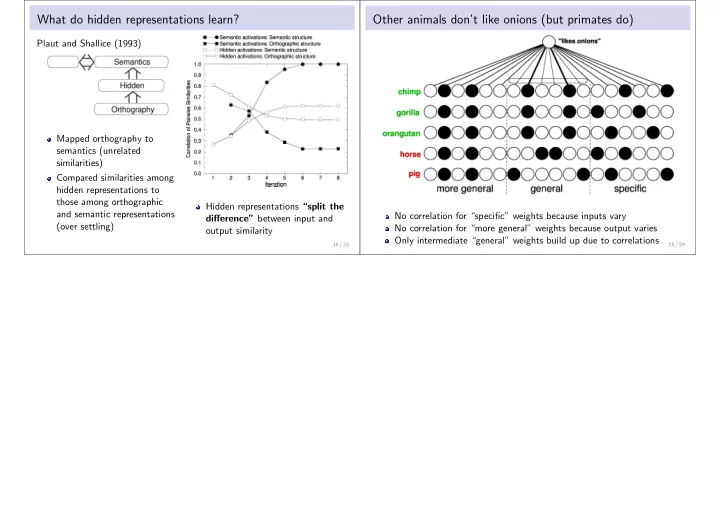
Plaut and Shallice (1993) Mapped orthography to semantics (unrelated similarities) Compared similarities among hidden representations to those among orthographic and semantic representations (over settling) Hidden representations “split the difference” between input and
- utput similarity
16 / 25
Other animals don’t like onions (but primates do)
No correlation for “specific” weights because inputs vary No correlation for “more general” weights because output varies Only intermediate “general” weights build up due to correlations
25 / 29