
SLIDE 1
A LITTLE BIT OF BACKGROUND ABOUT BACKGROUND
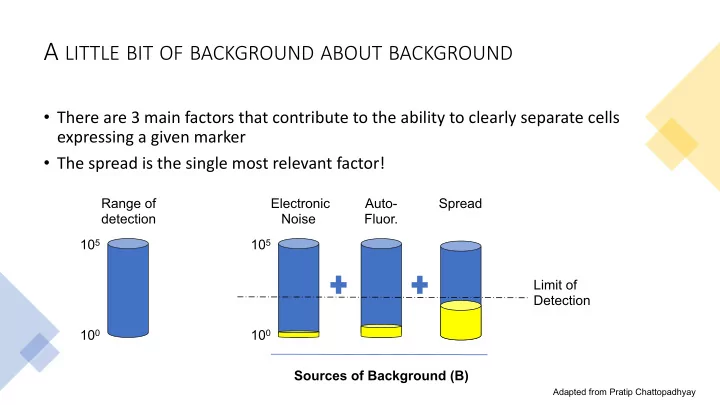
- There are 3 main factors that contribute to the ability to clearly separate cells
expressing a given marker
- The spread is the single most relevant factor!
Electronic Noise Auto- Fluor. Spread Sources of Background (B) Limit of Detection
Adapted from Pratip Chattopadhyay