statistics in biology
play

Statistics in Biology The Mean Mean ( x ) is a measure of the - PDF document

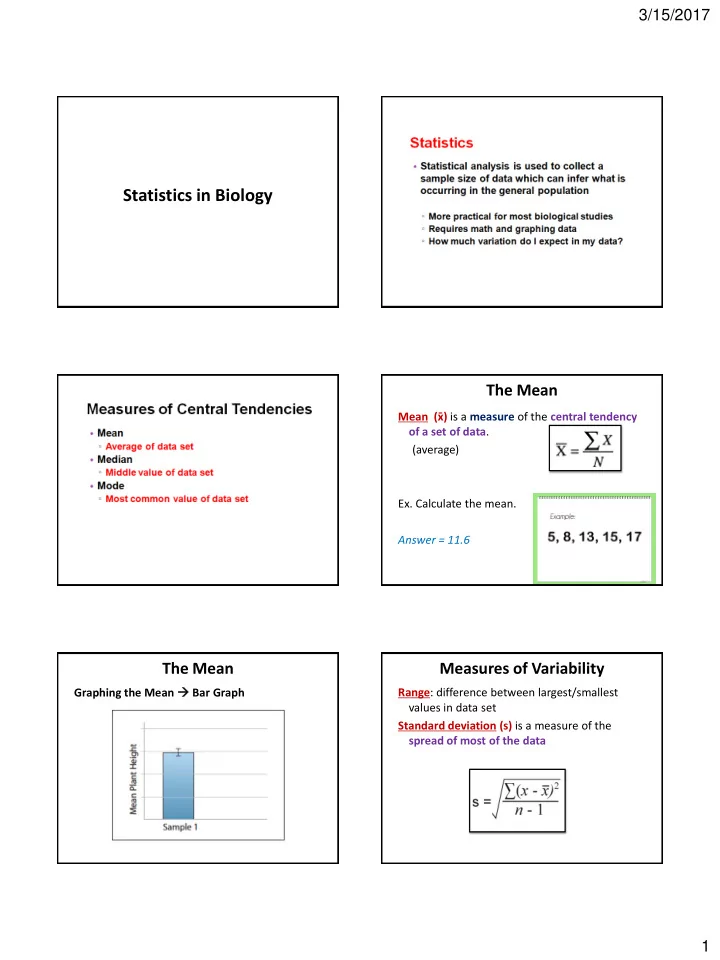
3/15/2017 Statistics in Biology The Mean Mean ( x ) is a measure of the central tendency of a set of data . (average) Ex. Calculate the mean. Answer = 11.6 The Mean Measures of Variability Graphing the Mean Bar Graph Range : difference


  1. 3/15/2017 Statistics in Biology The Mean Mean ( x̄ ) is a measure of the central tendency of a set of data . (average) Ex. Calculate the mean. Answer = 11.6 The Mean Measures of Variability Graphing the Mean  Bar Graph Range : difference between largest/smallest values in data set Standard deviation (s) is a measure of the spread of most of the data 1

  2. 3/15/2017 Standard Deviation Standard Deviation Standard Deviation 68% of all data fall within ± 1 standard deviation of the mean 95% of all data fall within ± 2 standard deviation of the mean 99.7% of all data fall within ± 3 standard deviation of the mean Standard Deviation Standard Deviation 2

  3. 3/15/2017 Standard Deviation Standard Deviation Calculating Standard Deviation Measurements of Confidence 1. Calculate the mean 4. Sum the Squares Uncertainty : the margin of error in a measurement Ex: digital scale: 126.4g ( ± 0.1g) 2. Determine the differences 5. Divide by sample size (n) – 1 3. Square the differences 6. Take the square root Standard Error of the Mean Standard Error (SE or SEM) Standard Error of the Mean (SE or SEM) : measures how close the sample mean is to the population mean • Measure of accuracy (if the true mean is known) • Measure of precision (if the true mean is not known) The greater the sample size, the less the uncertainty in the calculations 3

  4. 3/15/2017 Standard Error Standard Error 95% confidence interval (95% CI) : 95% confident that the true means falls between 2 SE above/below calculated mean Graph with error bars Graph with error bars representing representing SE of the mean 95% confidence interval Error Bars Error Bars Error Bars Error Bars • Look for overlap of error Significance of Data lines Which graph shows two means that are significantly different ? Hint: Look for the non-overlapping error bars. • If overlap- difference is NOT significant • If no overlap- difference IS significant Answer: The means in (c) are statistically different. 4

  5. 3/15/2017 Error Bars Error Bars Statements • More males in all four regions exhibited the trait measured than did females • More males in region 3 exhibited the trait measure than did females Statements • Fish2Whale food caused the most growth • Fish2Whale food caused more fish growth than did Budget Fude The End 5

Download Presentation
Download Policy: The content available on the website is offered to you 'AS IS' for your personal information and use only. It cannot be commercialized, licensed, or distributed on other websites without prior consent from the author. To download a presentation, simply click this link. If you encounter any difficulties during the download process, it's possible that the publisher has removed the file from their server.

Recommend


More recommend