visualization with virtual and augmented reality
play

Visualization with Virtual and Augmented Reality Tobias Isenberg and - PowerPoint PPT Presentation

Visualization with Virtual and Augmented Reality Tobias Isenberg and Xiyao Wang Who are we? Xiyao Wang Tobias Isenberg Senior researcher PhD student tobias.isenberg@inria.fr xiyao.wang@inria.fr http://xiyaowang.net/


  1. Visualization with Virtual and Augmented Reality Tobias Isenberg and Xiyao Wang

  2. Who are we? Xiyao Wang Tobias Isenberg Senior researcher PhD student tobias.isenberg@inria.fr xiyao.wang@inria.fr http://xiyaowang.net/ http://tobias/isenberg.cc

  3. What are VR and AR? images: Microsoft and Oculus [Milgram and Kishino 1994] Real environments with Entirely virtual environments virtual data/objects Users are isolated from real world Users can interact with real world

  4. Compared to traditional screen images: Univ. Groningen, LG, A. Wiebel less immersion high visual immersion → good stereo perception only w/ interaction → stereo perception w/o interaction → ppl. can understand 3D data well

  5. Scientific Visualization with Stereo • Does not rely on projection

  6. Scientific Visualization with Stereo • Does not rely on projection • Make use of spatial input devices (direct mapping) image Daniel F. Keefe

  7. Scientific Visualization with Stereo • Immersion helps data understanding [Prabhat et al. 2008]

  8. Scientific Visualization with Stereo • Immersion helps data understanding [Laha et al. 2012]

  9. Scientific Visualization with Stereo • Immersion helps data understanding [Mirhosseini et al. 2014]

  10. Some examples • Fully stereoscopic view [Hurter et al. 2018]

  11. Some examples [Taylor, II, et al. 1993]

  12. Some examples image: Daniel F. Keefe

  13. Some examples • Multiple views with stereoscopic view + touch input [Coffey et al. 2011/2012]

  14. Some examples • Multiple views with stereoscopic view + special input image Daniel F. Keefe

  15. Interaction has to be tailored to the view [Bruder et al. 2013]

  16. Interaction has to be tailored to the view • Stereo view + touch input that works [Butkiewicz & Ware, 2011]

  17. Tangible displays & stereoscopy • Mobile interaction with stereo [López et al, 2016]

  18. Visual representation and interaction [with S. Bruckner, T. Ropinski, and A. Wiebel, hopefully to appear soon]

  19. What do we want to do? Bring the visual immersion for HEP data analysis.

  20. What do we want to do? Bring the visual immersion for HEP data analysis. Current case: understanding the results of TrackML challenge

  21. What do we envision? Two linked views. Each view is interactable. Pointer goes from one to another.

  22. Why do we use such combination? Visual immersion Traditional analysis tools Not separated from real world Familiar environments Other input forms Typing, precise input, …

  23. Initial design • Interaction can be performed on both sides. • Linked views with the same dataset. • Similar user interface and functionalities.

  24. Prototype • Navigation • Abstraction of data and detector meshes. • Filtering and highlighting.

  25. Study • We preformed an observational study.

  26. Major feedback • Stereoscopic view offers better depth clue, benefiting the spatial understanding of the event, and for example, following the trajectories and observing their spatial arrangements. • The unlimited working space of AR could be useful for complex analysis (while 2D screen has a fixed size). • Being able to walk around the data has huge potentials compared to interaction on PC.

  27. Major feedback • Keeping the laptop and mouse is useful for precise interaction, and for dense information display (for its high resolution). • Mouse is not appreciated for AR space, what kind of input device can be used to unify the interaction across spaces? • Users lose interaction and context while walking around.

  28. Input and interaction techniques • 3D input device to match the stereo view in AR? 3D Mouse? Tangible devices? Map the interaction to a physical object’s movement.

  29. Input and interaction techniques • Study the mis-match of dimensionality between input and output devices. – Would 2D(3D) input match better the 2D(3D) output?

  30. Input and interaction techniques • 3D Docking task & 3D clipping plane task

  31. Input and interaction techniques • 3D Docking task & 3D clipping plane task – Tangible device is more nature for rough 3D manipulation. – Mouse still has the most previse results for specific tasks.

  32. Questions • How can we relate 2D graphs/plots and 3D representations? – Do we go back and forth between them? – Is one more important than the other, or are all equally important?

  33. Questions • In addition to scoring the results, how do we work with 3D representations to compare two or more ML-based results?

  34. Visualization with Virtual and Augmented Reality Tobias Isenberg Xiyao Wang PhD student Senior researcher xiyao.wang@inria.fr tobias.isenberg@inria.fr http://tobias/isenberg.cc
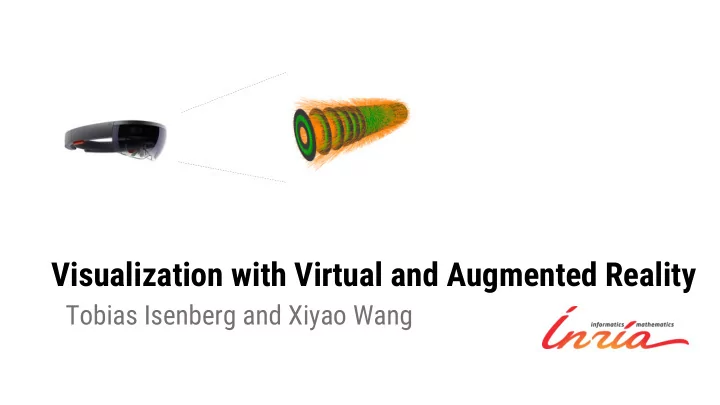
 http://xiyaowang.net/

Download Presentation
Download Policy: The content available on the website is offered to you 'AS IS' for your personal information and use only. It cannot be commercialized, licensed, or distributed on other websites without prior consent from the author. To download a presentation, simply click this link. If you encounter any difficulties during the download process, it's possible that the publisher has removed the file from their server.

Recommend


More recommend