Vibrational Spectroscopy of PAHs Shantanu Rastogi Department of - - PowerPoint PPT Presentation

vibrational spectroscopy of pahs
SMART_READER_LITE
LIVE PREVIEW

Vibrational Spectroscopy of PAHs Shantanu Rastogi Department of - - PowerPoint PPT Presentation

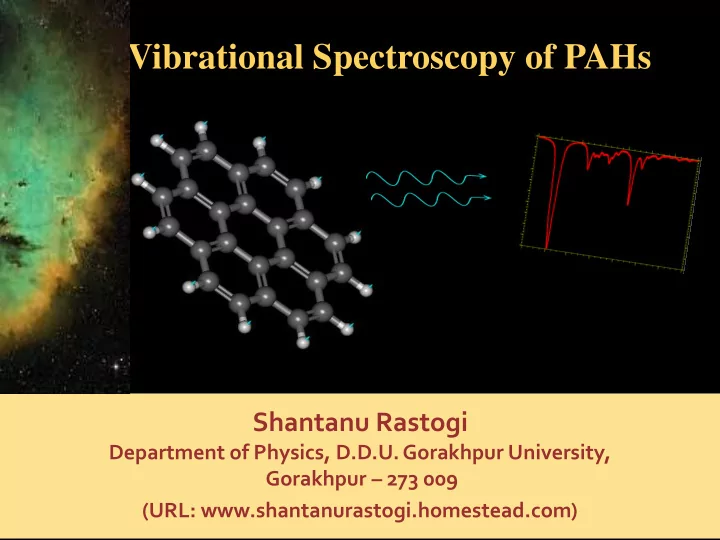
Vibrational Spectroscopy of PAHs Shantanu Rastogi Department of Physics, D.D.U. Gorakhpur University, Gorakhpur 273 009 (URL: www.shantanurastogi.homestead.com) Polycyclic Aromatic Hydrocarbons (PAHs) Ubiquitous in Space Detected


slide-1
SLIDE 1

Shantanu Rastogi

Department of Physics, D.D.U. Gorakhpur University, Gorakhpur – 273 009 (URL: www.shantanurastogi.homestead.com)

Vibrational Spectroscopy of PAHs

slide-2
SLIDE 2

 Emphysema is a lung disease; caused by exposure to toxic chemicals and tobacco smoke.

Polycyclic Aromatic Hydrocarbons (PAHs)

‘Ubiquitous’ in Space Detected via IR emission features at 3.3, 6.2, 7.7, 8.6, 11.2 & 12.7 mm

slide-3
SLIDE 3

ISO-SWS spectra,

(First ISO results, 1996, A&A, 315)

  • The features observed in a variety of

sources: planetary nebulae, reflection

nebulae, transition objects, novae, the galactic disk, and even external galaxies.

  • The bands: typical vibrational transitions in

Aromatic moieties, indicating widespread

presence of PAHs in the ISM.

Infrared emission features –

3030, 1613, 1299, 1163, 893 & 787 cm-1 (3.3, 6.2, 7.7, 8.6, 11.2 & 12.7 mm).

slide-4
SLIDE 4
  • 3030 cm-1 – CH stretching vibration
slide-5
SLIDE 5
  • 3030 cm-1 – CH stretching vibration
  • 1600 cm-1 – CC stretching vibration
  • 1300 – 1100 cm-1

– CC stretch + CH bend vibration

slide-6
SLIDE 6
  • 3030 cm-1 – CH stretching vibration
  • 1600 cm-1 – CC stretching vibration
  • 1300 – 1100 cm-1

– CC stretch + CH bend vibration

  • ~900 cm-1 – CH out of plane vibration
slide-7
SLIDE 7
  • 3030 cm-1 – CH stretching vibration
  • 1600 cm-1 – CC stretching vibration
  • 1300 – 1100 cm-1

– CC stretch + CH bend vibration

  • ~900 cm-1 – CH out of plane vibration
  • All vibrations are typical aromatic characteristics
  • No specific molecule identification possible
slide-8
SLIDE 8

a) Emission from IRAS 22272+5435 (a proto PNe) b) Absorption from PAH mixture (60% neutral + 40% ionized) c) Orion nebula emission spectra d) Absorption from a mixture of ionized PAHs only.

 In a population of emitters, each

unique signature blends into a composite spectrum representative of the whole family.

 More ionized species in star

forming regions and hydrogenated species in dense molecular clouds or outflows of AGB stars.

The emission features vary from source to source

slide-9
SLIDE 9

Matrix Isolation Spectroscopy (MIS)

IR /

Laboratory Study of PAH vibrations – Infrared spectroscopy

 Collision-free low temperature environment of ISM are reproduced in supersonic gas expansions.

slide-10
SLIDE 10

empty cavity sample

Cavity Ring Down Spectroscopy (CRDS)

I(t) = I1 exp(-tt)

t = L/cT (Ring Down time)

ts = L/c(T+aS) a = [1/ts – 1/t]*L/Sc

 Gas phase direct absorption

spectra.

 Low sample concentration –> less

absorption per pass –> accurate measurement of ring-down time.

 High reflectivity cavity mirrors lead to

long path lengths (~ 10 Km) and high resolution.

 PAHs injected into the cavity need to be

ionized through a discharge.

slide-11
SLIDE 11
  • Difficul

cult to obtain ex exper eriment imental al spec ectra tra in I ISM condition

  • ns
  • PAHs

s possi ssibl ble e in the e ISM difficul cult to syn ynthes esize ize

Quan antu tum m Chemi mical cal cal alcula lati tion

  • ns

s provi vide de th the mi miss ssin ing g li link nk.

  • Visua

ualize ze a p a possi sible ble PAH. H.

  • Optimize ge

geometry try – obt btai ain n normal al vibr brat ations. ions. Density ty Fun unctional ional Theory ry (DFT) ) ap applied for IR ab absor

  • rpti

ption

  • n

dat atabase abase.

slide-12
SLIDE 12

Cataconde condensed nsed PAHs

38 to 96

  • 96 C

atom

  • m PAHs

The Sample database – Plain PAHs DFT - B3LYP/4-31G

slide-13
SLIDE 13
  • Absorption of UV ‘hn’ photon excites the PAH to a peak temperature ~ 1000 K,

depending on size and absorption cross section.

  • Intersystem crossing / Internal conversion to very high vibrational levels;
  • Emission from v  v-1 levels in a cascade.

PAH Emission Mechanism

neutral cation

Meaningful comparison with observations require emission spectra

slide-14
SLIDE 14

Th The T Ther ermal E al Emis issio ion Mod Model

  • The thermal approximation for cascade emission model is considered

as average energy of individual modes is small compared to the total energy U(T) of the excited PAH.

  • ‘i’ is vibrational mode within individual PAH having frequency i in cm-1

and m is total number of normal modes (3N – 6; N being the number

  • f atoms). Emission photon flux for the ith mode is i.
  • For a fall in internal energy by U, the fractional energy emitted in

the ith mode is given as:

  • Fractional energy Ei is integrated over the cooling range from Tp to a

temperature of 50 K below which the energy emitted is negligible.

slide-15
SLIDE 15

Composite emission spectra neutrals cations

Model Ι – small PAHs; less than 30 carbon atoms Model ІІ – medium sized PAHs; 30-50 carbon atoms. Model ІІІ – large PAHs; up to ~100 carbon atoms.

slide-16
SLIDE 16

Enlarged Enlarged

7.7 7.7 µm ba m band nd

  • The 7.7 µm Aromatic IR Band has components at 7.6 and 7.8 µm.
  • 7.6 µm dominates in UV rich environments with processed PAHs.
  • 7 .8 µm feature dominates in cooler regions having newly formed PAHs.

Peeters et al., A&A 390, 1089, 2002

Class A' Class B'

Strong UV sources

Observational classifications

slide-17
SLIDE 17
  • The 7.6 mm feature dominant in UV rich regions matches the

model spectra of medium sized PAH cations (a).

  • The 7.8 mm component, observed in benign regions, correlates

with the model spectra of large PAH cations (b). Large PAHs form in out flows of post-AGB stars that transform to medium sized ones in strong UV sources.

Modeling observations - The “7.7” mm complex

slide-18
SLIDE 18

Emission from cations for the three models in the 1450 to 1650 cm-¹ region

  • The models do not satisfactorily match

the 6.2 μm feature.

  • Most spectra fall short by 30 - 40 cm-1

from this 1610 cm-1 AIB.

  • Study of a wider variety of PAHs

needed to explain all bands simultaneously.

Problems…

slide-19
SLIDE 19
  • The most favorable pathway is

condensation acetylene (C2H2).

  • Intermediate

products like acetylene, vinyl-radicals, poly-acetylene indicate the possibility of PAHs with side groups. Growth of PAHs in the ISM

slide-20
SLIDE 20

PAH with vinyl side groups

The presence of C=C bond in the vinyl side group on PAHs may increase the frequency of vibration of the C – C stretch mode.

2-vinyl-anthracene; 1625 cm-1 mainly vinyl C=C stretch

slide-21
SLIDE 21

PAH with vinyl side groups

The presence of C=C bond in the vinyl side group on PAHs may increase the frequency of vibration of the C – C stretch mode.

2-vinyl-anthracene; 1615 cm-1 mainly ring C – C stretch

slide-22
SLIDE 22

The database –

vinyl-PAHs DFT - B3LYP/4-31G Poster P-7

slide-23
SLIDE 23

PAH vibrational signatures in the Far-infrared

  • beyond 20 mm (500 cm-1)

C96 Jumping jack, 570 cm-1 (17.5 mm)

slide-24
SLIDE 24

PAH vibrational signatures in the Far-infrared

  • beyond 20 mm (500 cm-1)

Coronene Drum head, 118 cm-1 (84 mm) C96 Drum head 300 cm-1 (33 mm)

slide-25
SLIDE 25

PAH vibrational signatures in the Far-infrared

  • beyond 20 mm (500 cm-1)

Drum heads – edge not fixed

slide-26
SLIDE 26

C90 Swimming – breast stroke 130 cm-1 (77 micron) C96 Swimming – breast stroke 195 cm-1 (51 micron)

PAH vibrational signatures in the Far-infrared

  • beyond 20 mm (500 cm-1)
slide-27
SLIDE 27

Lattice / skeletal motions Extremely large PAHs --> Graphene

slide-28
SLIDE 28

James Webb Space Telescope Herschel Space Telescope

 3.5 metre diameter  55 – 672 µm range  6.5 metre diameter  0.6 – 28 µm range