
SLIDE 1
Infrared Spectroscopy Sample IR Spectrum: ! General Theory of IR - - PowerPoint PPT Presentation
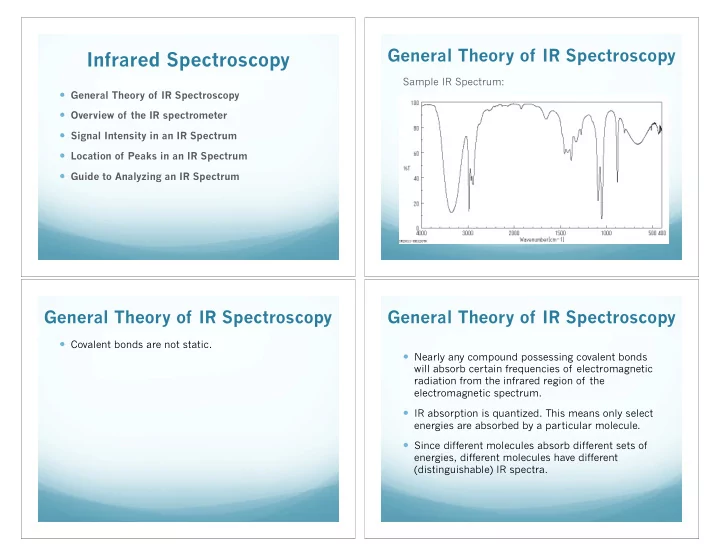
General Theory of IR Spectroscopy Infrared Spectroscopy Sample IR Spectrum: ! General Theory of IR Spectroscopy ! Overview of the IR spectrometer ! Signal Intensity in an IR Spectrum ! Location of Peaks in an IR Spectrum ! Guide to Analyzing an IR
1-heptene 3-heptene
< 1400 cm-1 Fingerprint Region > 1400 cm-1 Functional Group Region
Two General Regions in an IR Spectrum:
Z – H single bond stretches
More Specific Regions in an IR Spectrum:
Bending vibrations Single bond stretches Double bond stretches Triple bond stretches 400 1000 1500 2000 2500 4000 cm-1
Some factors affecting peak location:
to a lighter atom will be greater than the same bond connected to a heavier atom.
frequency than a weaker bond.
H – Cl vs H – Br CC > C=C > C–C
Generally broad and intense ~3300 cm-1 4000 3000 2000 1500 1000 500 HO 2-butyn-1-ol
A Carboxylic Acid O–H stretch is generally lower in frequency and even more broad than an alcohol OH. Often ~3000 cm-1
Generally less broad and less intense than the OH stretch. Generally appear between 3300 and 3500 cm-1 Primary amines R-NH2 exhibit two N-H stretching bands. 4000 3000 2000 1500 1000 500
Wavenumber (cm-1)
NH2 isopropylamine
Generally less broad and less intense than the OH stretch. Generally appear between 3300 and 3500 cm-1 Secondary amines R2NH exhibit one N-H stretching band. 4000 3000 2000 1500 1000 500
Wavenumber (cm-1)
N H diethylamine
All C–H stretches occur between 2700 and 3300 cm-1. They are relatively intense and typically quite narrow. Csp3–H (-CH2–H) appear just below3000 cm-1 4000 3000 2000 1500 1000 500
Wavenumber (cm-1)
hexane
All C–H stretches occur between 2700 and 3300 cm-1. They are relatively intense and typically quite narrow. Csp2–H (C=C–H) appear just above 3000 cm-1 4000 3000 2000 1500 1000 500
Wavenumber (cm-1)
Csp3–H Csp2–H 2-hexene
The C=O stretch is very strong and generally appears between 1650-1850 cm-1
! ! 1750=1850* ! 1700=1750* * 1720=1740* ! 1680=1750* ! 1650=1700*
O Cl O RO O H O O H2N
The C=O stretch is very strong and generally appears between 1650-1850 cm-1 4000 3000 2000 1500 1000 500
Wavenumber (cm-1)
O 1710 cm-1
When the C=O is in conjugation to a C=C or a CC, the frequency is lowered 20-40 cm-1 1690 cm-1 O
In addition to the C=O stretch, the aldehyde C–H stretch appears as two bands. One will be at ~2720 and the other at ~2820 cm-1. 4000 3000 2000 1500 1000 500
Wavenumber (cm-1)
O H
Both CC and CN bonds appear as a sharp peak between 2100 and 2260 cm-1. Internal alkynes and nitriles are generally difficult to distinguish. 4000 3000 2000 1500 1000 500 HO 2-butyn-1-ol 2210 cm-1
Terminal alkynes are much easier to identify. In addition to the CC stretch, a sharp C–H stretch at ~3300 cm-1 will also be observed. 4000 3000 2000 1500 1000 500
C=C stretches are one of the more difficult functional groups to identify in an IR spectrum. Alkene stretches occur between 1620 and 1680 cm-1. They are sharper and less intense than C=O signals. 4000 3000 2000 1500 1000 500
Wavenumber (cm-1)
2-hexene
C=C stretches corresponding to an aromatic ring generally occur between 1450 and 1600 cm-1. There can be up to three signals: One at ~1600, One at ~1500, and one slightly <1500 cm-1. 4000 3000 2000 1500 1000 500
The carbon—oxygen bond in an alcohol is a pure single bond. The carbon—oxygen bond in an ether is a pure single bond. The carbon—oxygen single bond in a carboxylic acid has partial double bond character. One carbon—oxygen single bond in an ester is a pure single bond and one has partial double bond character. Csp3–O 1000-1100 cm-1 Csp2–O 1200-1300 cm-1
4000 3000 2000 1500 1000 500
OH 2-butanol
Csp3–O 1000-1100 cm-1
Csp3–O 1000-1100 cm-1 Csp2–O 1200-1300 cm-1 4000 3000 2000 1500 1000 500
O O
Bending vibrations are generally less pronounced than stretching. Additionally, because the bending vibrations are generally found in the fingerprint region, they are often hard to identify.
R2CH2 and R3CH bending just above 1400 cm-1 4000 3000 2000 1500 1000 500
Wavenumber (cm-1)
2-hexene
4000 3000 2000 1500 1000 500 Wavenumber (cm-1)
4000 3000 2000 1500 1000 500 Wavenumber (cm-1)
OH
4000 3000 2000 1500 1000 500 Wavenumber (cm-1)
O NH2
4000 3000 2000 1500 1000 500 Wavenumber (cm-1) O
O OH O HO O O
4000 3000 2000 1500 1000 500 Wavenumber (cm-1)
4000 3000 2000 1500 1000 500 Wavenumber (cm-1) O HO
4000 3000 2000 1500 1000 500 Wavenumber (cm-1)
O OH