Variance; Continuous Random Variables 18.05 Spring 2014 January 1, - - PowerPoint PPT Presentation

variance continuous random variables 18 05 spring 2014
SMART_READER_LITE
LIVE PREVIEW

Variance; Continuous Random Variables 18.05 Spring 2014 January 1, - - PowerPoint PPT Presentation

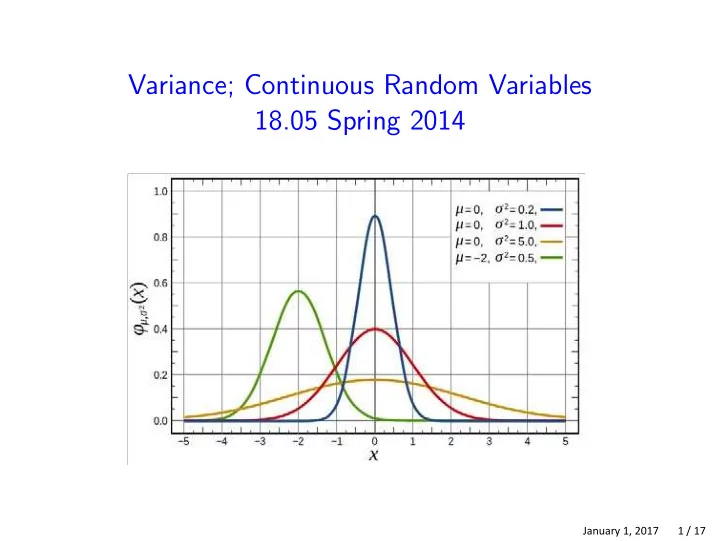
Variance; Continuous Random Variables 18.05 Spring 2014 January 1, 2017 1 / 17 Variance and standard deviation X a discrete random variable with mean E ( X ) = . Meaning: spread of probability mass about the mean. Definition as


slide-1
SLIDE 1

Variance; Continuous Random Variables 18.05 Spring 2014

January 1, 2017 1 / 17

slide-2
SLIDE 2

Variance and standard deviation X a discrete random variable with mean E (X ) = µ. Meaning: spread of probability mass about the mean. Definition as expectation (weighted sum): Var(X ) = E ((X − µ)2). Computation as sum:

n

n Var(X ) = p(xi )(xi − µ)2 .

i=1

Standard deviation σ = Var(X ). Units for standard deviation = units of X .

January 1, 2017 2 / 17

slide-3
SLIDE 3

Concept question

The graphs below give the pmf for 3 random variables. Order them by size of standard deviation from biggest to smallest. (Assume x has the same units in all 3.)

x 1 2 3 4 5 (A) x 1 2 3 4 5 (B) x 1 2 3 4 5 (C)

  • 1. ABC
  • 2. ACB
  • 3. BAC
  • 4. BCA
  • 5. CAB
  • 6. CBA

January 1, 2017 3 / 17

slide-4
SLIDE 4

Computation from tables

  • Example. Compute the variance and standard deviation
  • f X .

values x 1 2 3 4 5 pmf p(x) 1/10 2/10 4/10 2/10 1/10

January 1, 2017 4 / 17

slide-5
SLIDE 5

Concept question Which pmf has the bigger standard deviation? (Assume w and y have the same units.)

  • 1. Y
  • 2. W

y p(y) 3

  • 3

1/2 pmf for Y w p(W) 10 20 30 40 50 .1 .2 .4 pmf for W

Table question: make probability tables for Y and W and compute their standard deviations.

January 1, 2017 5 / 17

slide-6
SLIDE 6

Concept question True or false: If Var(X ) = 0 then X is constant.

  • 1. True
  • 2. False

January 1, 2017 6 / 17

slide-7
SLIDE 7

Algebra with variances If a and b are constants then Var(aX + b) = a

2 Var(X ),

σaX +b = |a| σX . If X and Y are independent random variables then Var(X + Y ) = Var(X ) + Var(Y ).

January 1, 2017 7 / 17

slide-8
SLIDE 8

Board questions

  • 1. Prove: if X ∼ Bernoulli(p) then Var(X ) = p(1 − p).
  • 2. Prove: if X ∼ bin(n, p) then Var(X ) = n p(1 − p).
  • 3. Suppose X1, X2, . . . , Xn are independent and all have

the same standard deviation σ = 2. Let X be the average

  • f X1, . . . , Xn.

What is the standard deviation of X ?

January 1, 2017 8 / 17

slide-9
SLIDE 9

Continuous random variables Continuous range of values: [0, 1], [a, b], [0, ∞), (−∞, ∞). Probability density function (pdf) d f (x) ≥ 0; P(c ≤ x ≤ d) = f (x) dx.

c

prob. Units for the pdf are unit of x Cumulative distribution function (cdf) x F (x) = P(X ≤ x) = f (t) dt.

−∞

January 1, 2017 9 / 17

slide-10
SLIDE 10

Visualization

x f(x) c d P(c ≤ X ≤ d)

pdf and probability

x f(x) x F(x) = P(X ≤ x)

pdf and cdf

January 1, 2017 10 / 17

slide-11
SLIDE 11

Properties of the cdf (Same as for discrete distributions) (Definition) F (x) = P(X ≤ x). 0 ≤ F (x) ≤ 1. non-decreasing. 0 to the left: lim F (x) = 0.

x→−∞

1 to the right: lim F (x) = 1.

x→∞

P(c < X ≤ d) = F (d) − F (c). F

'(x) = f (x).

January 1, 2017 11 / 17

slide-12
SLIDE 12

Board questions

2

  • 1. Suppose X has range [0, 2] and pdf f (x) = cx .

(a) What is the value of c. (b) Compute the cdf F (x). (c) Compute P(1 ≤ X ≤ 2).

  • 2. Suppose Y has range [0, b] and cdf F (y) = y 2/9.

(a) What is b? (b) Find the pdf of Y .

January 1, 2017 12 / 17

slide-13
SLIDE 13

Concept questions Suppose X is a continuous random variable. (a) What is P(a ≤ X ≤ a)? (b) What is P(X = 0)? (c) Does P(X = a) = 0 mean X never equals a?

January 1, 2017 13 / 17

slide-14
SLIDE 14

Concept question

Which of the following are graphs of valid cumulative distribution functions? Add the numbers of the valid cdf’s and click that number.

January 1, 2017 14 / 17

slide-15
SLIDE 15

Exponential Random Variables

Parameter: λ (called the rate parameter). Range: [0, ∞). Notation: exponential(λ) or exp(λ). Density: f (x) = λe−λx for 0 ≤ x. Models: Waiting time

x P(3 < X < 7) 2 4 6 8 10 12 14 16 .1 f(x) = λe−λx x F(x) = 1 − e−x/10 2 4 6 8 10 12 14 16 1

Continuous analogue of geometric distribution –memoryless!

January 1, 2017 15 / 17

slide-16
SLIDE 16

Board question

I’ve noticed that taxis drive past 77 Mass. Ave. on the average of

  • nce every 10 minutes.

Suppose time spent waiting for a taxi is modeled by an exponential random variable X ∼ Exponential(1/10); f (x) = 1 10 e

−x/10

(a) Sketch the pdf of this distribution (b) Shade the region which represents the probability of waiting between 3 and 7 minutes (c) Compute the probability of waiting between between 3 and 7 minutes for a taxi (d) Compute and sketch the cdf.

January 1, 2017 16 / 17

slide-17
SLIDE 17

MIT OpenCourseWare https://ocw.mit.edu

18.05 Introduction to Probability and Statistics

Spring 2014 For information about citing these materials or our Terms of Use, visit: https://ocw.mit.edu/terms.