Unit 5: Inference for categorical data 3. Chi-square testing - - PowerPoint PPT Presentation

unit 5 inference for categorical data 3 chi square testing
SMART_READER_LITE
LIVE PREVIEW

Unit 5: Inference for categorical data 3. Chi-square testing - - PowerPoint PPT Presentation

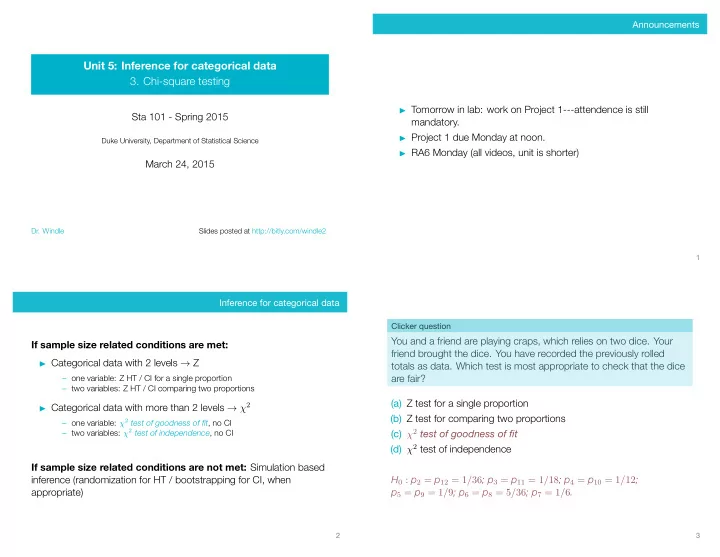
Announcements Unit 5: Inference for categorical data 3. Chi-square testing Tomorrow in lab: work on Project 1---attendence is still Sta 101 - Spring 2015 mandatory. Project 1 due Monday at noon. Duke University, Department of


slide-1
SLIDE 1

Unit 5: Inference for categorical data

  • 3. Chi-square testing

Sta 101 - Spring 2015

Duke University, Department of Statistical Science

March 24, 2015

  • Dr. Windle

Slides posted at http://bitly.com/windle2

Announcements ▶ Tomorrow in lab: work on Project 1---attendence is still

mandatory.

▶ Project 1 due Monday at noon. ▶ RA6 Monday (all videos, unit is shorter)

1

Inference for categorical data

If sample size related conditions are met:

▶ Categorical data with 2 levels → Z

– one variable: Z HT / CI for a single proportion – two variables: Z HT / CI comparing two proportions

▶ Categorical data with more than 2 levels → χ2

– one variable: χ2 test of goodness of fit, no CI – two variables: χ2 test of independence, no CI

If sample size related conditions are not met: Simulation based inference (randomization for HT / bootstrapping for CI, when appropriate)

2

Clicker question

You and a friend are playing craps, which relies on two dice. Your friend brought the dice. You have recorded the previously rolled totals as data. Which test is most appropriate to check that the dice are fair? (a) Z test for a single proportion (b) Z test for comparing two proportions (c) χ2 test of goodness of fit (d) χ2 test of independence H0 : p2 = p12 = 1/36; p3 = p11 = 1/18; p4 = p10 = 1/12; p5 = p9 = 1/9; p6 = p8 = 5/36; p7 = 1/6.

3

slide-2
SLIDE 2

Clicker question

A Gallup poll asked whether or not respondents identify as Tea Party Republican (yes / no) and whether or not they are motivated to vote in the upcoming midterm election (yes / no). We want to find out whether being a Tea Party Republican is associated with motivation to vote. Which test is most appropriate? (a) Z test for a single proportion (b) Z test for comparing two proportions (c) χ2 test of goodness of fit (d) χ2 test of independence H0 : pTPR = pOther, where p = probability of being motivated to vote

4

Clicker question

Suppose the Gallup poll instead asked about

▶ party affiliation (Tea Party Republican, Other Republican, and

Non-Republican), and

▶ motivation to vote (extremely unmotivated, very unmotivated,

unmotivated, motivated, very motivated, extremely motivated) We want to find out whether party affiliation is associated with motivation to vote. Which test is most appropriate? (a) Z test for a single proportion (b) Z test for comparing two proportions (c) χ2 test of goodness of fit (d) χ2 test of independence H0 : Party affiliation and motivation to vote are independent

5

The χ2 statistic

χ2 statistic: When dealing with counts and investigating how far the

  • bserved counts are from the expected counts, we use a new test

statistic called the chi-square (χ2) statistic: χ2 =

k

i=1

(O − E)2 E where k = total number of cells Important points:

▶ Use counts (not proportions) in the calculation of the test

statistic, even though we're truly interested in the proportions for inference

▶ Expected counts are calculated assuming the null hypothesis is

true

6

Expected Counts

Example: does survival on the Titanic depend on cabin class? Observed counts: 1st 2nd 3rd no 123 158 528 yes 200 119 181 Column props.: 1st 2nd 3rd no 0.38 0.57 0.74 yes 0.62 0.43 0.26 Intuition: Eno, 1st = ˆ pno × ˆ p1st × (total # obs) Simplification: Eno, 1st = row ``no'' total × col ``1st'' total table total = 809 × 323 1309 = 199.6 χ2

titanic = 127.9 7

slide-3
SLIDE 3

The χ2 distribution

The χ2 distribution has just one parameter, degrees of freedom (df), which influences the shape, center, and spread of the distribution.

▶ For χ2 GOF test: df = k − 1 ▶ For χ2 independence test: df = (R − 1) × (C − 1)

5 10 15 20 25 Degrees of Freedom 2 4 9

8

Finding areas under the chi-square curve

p-value = tail area under the chi-square distribution (as usual)

▶ Using the applet: http://bit.ly/dist_calc ▶ Using R: pchisq() ▶ Using the table: works a lot like the t table, but only provides

upper tail values.

5 10 15 20 25

Upper tail 0.3 0.2 0.1 0.05 0.02 0.01 0.005 0.001 df 1 1.07 1.64 2.71 3.84 5.41 6.63 7.88 10.83 2 2.41 3.22 4.61 5.99 7.82 9.21 10.60 13.82 3 3.66 4.64 6.25 7.81 9.84 11.34 12.84 16.27 4 4.88 5.99 7.78 9.49 11.67 13.28 14.86 18.47 5 6.06 7.29 9.24 11.07 13.39 15.09 16.75 20.52 6 7.23 8.56 10.64 12.59 15.03 16.81 18.55 22.46 · · · 9

Computing a p-value using the table

Clicker question

In the Titanic example, χ2

titanic = 127.9 and df = 2. Based on the table

from the previous slide, which of the following is correct? (Hint: draw a picture!) (a) The p-value for this data set will be in the interval (0.02, 0.05]. (b) The p-value for this data set will be in the interval (0.01, 0.02]. (c) The p-value for this data set will be in the interval (0.005, 0.01]. (d) The p-value for this data set will be in the interval (0.001, 0.005]. (e) The p-value for this data set will be at or below 0.001.

10

Interpretation

Clicker question

What is the best interpretation of the hypothesis test? (a) There is not convincing evidence that survival and cabin class are dependent. (b) There is convincing evidence that survival and cabin class are dependent.

11

slide-4
SLIDE 4

Conditions for χ2 testing

  • 1. Independence: In addition to what we previously discussed for

independence, each case that contributes a count to the table must be independent of all the other cases in the table.

  • 2. Sample size / distribution: Each cell must have at least 5

expected cases.

12

Application exercise: 5.3 Chi-square tests

See course website for details.

13

Recap: Does smoking habit depend on exercise habit?

Does smoking habit depend on exercise habit? Freq.Exer Not.Freq.Exer Total Non.Smoker 87 102 189 Smoker 28 19 47 Total 115 121 236

▶ H0: pfreq. exer = pnot freq. exer ▶ HA: pfreq. exer ̸= pnot freq. exer

14

Randomization test for the difference of two proportions

  • 1. Use 236 index cards, where each card represents an
  • bservation.
  • 2. Mark 189 of the cards as ``Non Smoker'' and the remaining 47

as ``Smoker.''

  • 3. Shuffle the cards and split into two groups of size of size 115

and 121 corresponding to ``Freq. Exer'' and ``Not Freq. Exer'' respectively.

  • 4. Calculate the difference between the proportions of ``Non

Smoking" in the frequent exercise and not frequent exercise groups, and record this number.

  • 5. Repeat steps (3) and (4) many times to build a randomization

distribution of differences in simulated proportions.

15

slide-5
SLIDE 5

Recap: Does smoking habit depend on exercise habit?

Does smoking habit depend on exercise habit? Freq None Some Total Heavy 7 1 3 11 Never 87 18 84 189 Occas 12 3 4 19 Regul 9 1 7 17 Total 115 23 98 236

▶ H0: smoking habits are not dependent on exercise habits. ▶ HA: smoking habits are depenednet on exercise habits.

16

Randomization test for the dependence of two categorical variables

  • 1. Use 236 index cards, where each card represents an
  • bservation.
  • 2. Mark 11 of the cards ``Heavy'', 189 of the cards ``Never'', 19 of

the cards ``Occas'', 17 of the cards ``Regul''.

  • 3. Shuffle the cards and split into 3 groups of size of size 115, 23,

and 98 corresponding to ``Freq'', ``None'', and ``Some'' respectively.

  • 4. Calculate the the χ2 test statistic for the shuffled data.
  • 5. Repeat steps (3) and (4) many times to build a randomization

distribution of many χ2 test statistics.

17

Randomization test for the dependence of two categorical variables

Check out chisq-randomization.R on the course website.

18

Summary of main ideas

  • 1. Categorical data: 2 levels → Z, >2 levels → χ2 square
  • 2. The χ2 statistic is always positive and right skewed
  • 3. At least 5 expected successes for χ2 testing

19