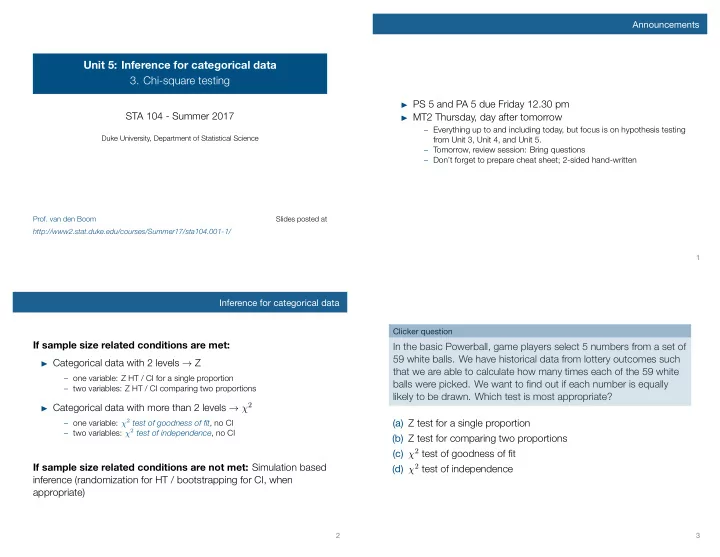

Announcements Unit 5: Inference for categorical data 3. Chi-square testing ▶ PS 5 and PA 5 due Friday 12.30 pm STA 104 - Summer 2017 ▶ MT2 Thursday, day after tomorrow – Everything up to and including today, but focus is on hypothesis testing Duke University, Department of Statistical Science from Unit 3, Unit 4, and Unit 5. – Tomorrow, review session: Bring questions – Don’t forget to prepare cheat sheet; 2-sided hand-written Prof. van den Boom Slides posted at http://www2.stat.duke.edu/courses/Summer17/sta104.001-1/ 1 Inference for categorical data Clicker question If sample size related conditions are met: In the basic Powerball, game players select 5 numbers from a set of 59 white balls. We have historical data from lottery outcomes such ▶ Categorical data with 2 levels → Z that we are able to calculate how many times each of the 59 white – one variable: Z HT / CI for a single proportion balls were picked. We want to find out if each number is equally – two variables: Z HT / CI comparing two proportions likely to be drawn. Which test is most appropriate? ▶ Categorical data with more than 2 levels → χ 2 – one variable: χ 2 test of goodness of fit , no CI (a) Z test for a single proportion – two variables: χ 2 test of independence , no CI (b) Z test for comparing two proportions (c) χ 2 test of goodness of fit (d) χ 2 test of independence If sample size related conditions are not met: Simulation based inference (randomization for HT / bootstrapping for CI, when appropriate) 2 3
Clicker question Clicker question Suppose the Gallup poll instead asked about A Gallup poll asked whether or not respondents identify as Tea Party ▶ party affiliation (Tea Party Republican, Other Republican, and Republican (yes / no) and whether or not they are motivated to vote Non-Republican), and in the upcoming midterm election (yes / no). We want to find out ▶ motivation to vote (extremely unmotivated, very unmotivated, whether being a Tea Party Republican is associated with motivation unmotivated, motivated, very motivated, extremely motivated) to vote. Which test is most appropriate? We want to find out whether party affiliation is associated with motivation to vote. Which test is most appropriate? (a) Z test for a single proportion (b) Z test for comparing two proportions (a) Z test for a single proportion (c) χ 2 test of goodness of fit (b) Z test for comparing two proportions (d) χ 2 test of independence (c) χ 2 test of goodness of fit (d) χ 2 test of independence 4 5 The χ 2 statistic The χ 2 distribution The χ 2 distribution has just one parameter, degrees of freedom (df) , χ 2 statistic: When dealing with counts and investigating how far the which influences the shape, center, and spread of the distribution. observed counts are from the expected counts, we use a new test ▶ For χ 2 GOF test: df = k − 1 statistic called the chi-square ( χ 2 ) statistic : ▶ For χ 2 independence test: df = ( R − 1) × ( C − 1) k ( O − E ) 2 χ 2 = where k = total number of cells ∑ Degrees of Freedom E 2 i =1 4 9 Important points: ▶ Use counts ( O for ‘observered’) (not proportions ) in the calculation of the test statistic, even though we’re truly interested in the proportions for inference ▶ Expected counts ( E ) are calculated assuming the null hypothesis is true 0 5 10 15 20 25 6 7
Conditions for χ 2 testing Finding areas under the chi-square curve p -value = tail area under the chi-square distribution (as usual) ▶ Using the applet: https://gallery.shinyapps.io/dist_calc/ ▶ Using R: pchisq(q = chisq, df = df) ▶ Using the table: works a lot like the t table, but only provides upper tail values. 1. Independence: In addition to what we previously discussed for independence, each case that contributes a count to the table must be independent of all the other cases in the table. 2. Sample size / distribution: Each cell must have at least 5 expected cases. 0 5 10 15 20 25 Upper tail 0.3 0.2 0.1 0.05 0.02 0.01 0.005 0.001 df 1 1.07 1.64 2.71 3.84 5.41 6.63 7.88 10.83 2 2.41 3.22 4.61 5.99 7.82 9.21 10.60 13.82 3 3.66 4.64 6.25 7.81 9.84 11.34 12.84 16.27 4 4.88 5.99 7.78 9.49 11.67 13.28 14.86 18.47 5 6.06 7.29 9.24 11.07 13.39 15.09 16.75 20.52 6 7.23 8.56 10.64 12.59 15.03 16.81 18.55 22.46 · · · 8 9 Clicker question Suppose a poll asked the following questions: ▶ How would you identify your socio-economic status: low, middle, high? ▶ What type of pet did you have growing up, select all that apply: cat, dog, fish, bird, rodent, none of the above? Application exercise: 5.3 Chi-square tests What test is most appropriate for evaluating the relationship See course website for details. between these two variables? (a) Z test for a single proportion (b) Z test for comparing two proportions (c) χ 2 test of goodness of fit (d) χ 2 test of independence (e) none of the above 10 11
Summary of main ideas 1. Categorical data: 2 levels → Z, > 2 levels → χ 2 square 2. The χ 2 statistic is always positive and right skewed 3. At least 5 expected successes for χ 2 testing 12
Recommend
More recommend