
SLIDE 1
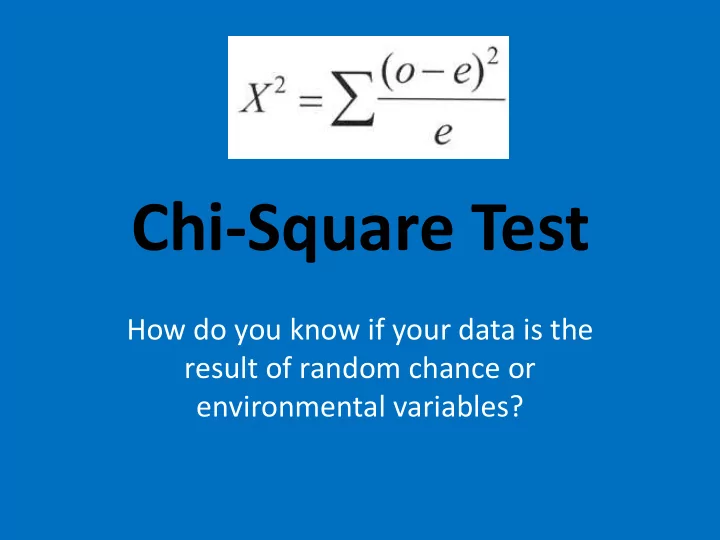
Chi-Square Test
How do you know if your data is the result of random chance or environmental variables?
Chi-Square Test How do you know if your data is the result of - - PowerPoint PPT Presentation
Chi-Square Test How do you know if your data is the result of random chance or environmental variables? Chi-Square Test Used to compare categorical data and evaluate if differences between the data sets are statistically significant or due
How do you know if your data is the result of random chance or environmental variables?
evaluate if differences between the data sets are statistically significant or due to chance In other words…
expected data due to chance or due to other factors (variables)?
Chi-square Sum Observed values Expected values
difference between the observed and expected frequencies
there is a less than 5% chance that the variation in the data is due to random/chance events
“nullify”) the null hypothesis
Null Hypothesis (H0) The application of fertilizer does not affect plant growth. Alternative Hypothesis (H1) The application of fertilizer affects plant growth.
Null Hypothesis (H0) Alternative Hypothesis (H1)
Expected Values? Observed Values?
hypothesis
to chance (bad data!)
some variable in the experiment (good data!)
(number of possible outcomes – 1)
Square Distribution Table (p = 0.05, or 95% sure)
critical value
Then you CANNOT claim that the variation in the data observed is due to the variable you are testing
Not Significant Significant
than) the critical value, then you reject the null hypothesis. This means that the variation in the data is due to a variable being tested (“statistically significant”).
value, then you fail to reject the null
the data is due to chance.