
SLIDE 1
Understanding Anthropogenic Impact on Peatlands GHGs
Dominique Blain, PhD Dominique Blain, PhD IPCC TFI Side Event M iti H t l B Maritim Hotel, Bonn 8 June 2011
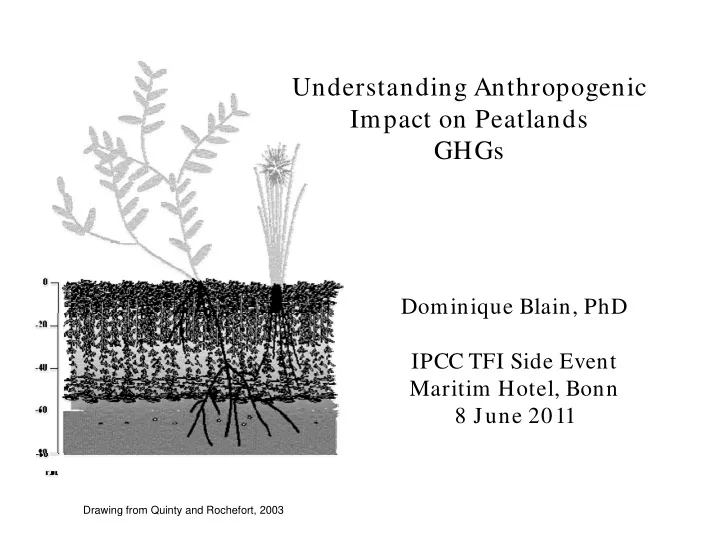
Drawing from Quinty and Rochefort, 2003
Understanding Anthropogenic Impact on Peatlands GHGs Dominique - - PowerPoint PPT Presentation
Understanding Anthropogenic Impact on Peatlands GHGs Dominique Blain, PhD Dominique Blain, PhD IPCC TFI Side Event M Maritim Hotel, Bonn iti H t l B 8 June 2011 Drawing from Quinty and Rochefort, 2003 Page 2 A P A Proposed Approach d
Drawing from Quinty and Rochefort, 2003
Page 2
Peatlands are the main wetlands reservoir for soil C. World-wide they contain about 450 Gt C, most in the northern peatlands & about 60 Gt in tropical regions (this number very uncertain).
After Strack et al. 2008. Peatlands and Climate Change. International Peat Society, Vapaudenkatu, Jyvaskyla, Finland.
Page 4
R E t R i ti
GPP – Gross primary productivity (CO2) Plant respiration (CO2) Soil respiration (CO2) Re - Ecosystem Respiration
(
2)
vascular plants
(
2)
Methane flux (CH4)
moss water table
methane
Peat/soil water table
methanogenesis
NEP = - NEE
Blain & Lafleur, 2010
Page 5
Worrel et al. (2003) Roulet et al.( 2007)
Nilsson et al. (2008) Dinsmore et al. (2010) Flanagan et al. (2010) L d (2009)
Lund (2009) Jac.-Kor. (2009)
Page 6
After Lafleur, 2009
Page 7
Lafleur, 2009
1000
Fort Simpson NWT Schefferville QC Thompson MB Clay Belt ON Finland
Churchill, MN Schefferville QC Dorset ON Kejimkujik NS Riviere du Loup QC Shippagan NB
B
10 100 ux (mg m-2 d-1)
Riviere du Loup QC Shippagan NB Mer Bleue ON Radisson QC
4
1 10 Average CH4 fl
Mer Bleue
after Moore TR, unpub.
0.1
, p
Average water table position (cm)
Page 8
Page 9
GPP G i Re - Ecosystem Respiration
GPP – Gross primary productivity (CO2) Plant respiration (CO2) Soil respiration (CO2) Methane flux
vascular plants
Methane flux (CH4)
moss water table
methane
Acrotelm
Peat/soil
methanogenesis
Catotelm
Strack and Waddington, 2007
Page 10
Page 11
Price and Whitehead, 2004
McNeil and Waddington, 2003
Waddington et al., 2002 Waddington et al 2008
Waddington et al., 2008 Quinty and Rochefort, 2003
Page 12
Poulin et al., 2005 Waddington et al., 2008
Waddington and Day, 2007
Lucchese et al., 2010
Page 13
Page 14
e
Page 15
Nelleman and Corcoran 2010; FAO 2005.
Page 16
Page 17
Bl i D d L fl P 2010 S i d d ti ti f tl d i i IPCC E t ti WMO G 20 O t b 2010 Blain D. and Lafleur P. 2010 Science advances and estimation of wetland emissionsIPCC Expert meeting WMO Geneva, 20 October 2010
Jackowicz-Korczynski, M. 2009. Land-atmosphere interactions at a subarctic palsa mire. Unpublished Ph.D. thesis, Lund University, Lund Sweden, 102 p. Lafleur, P.M. 2009. Connecting Atmosphere and Wetland: Trace Gas exchange. Geography Compass, 3/2, 560–585. Lucchese, M.C., Waddington, J.M., Poulin, M., Pouliot, R., Rochefort, L., and Strack, M. 2010. Organic matter accumulation in a restored peatland: g g p Evaluating restoration success. Ecological Engineering, 36, 482–488. Lund, M. 2009. Peatlands at a Threshold. Unpublished Ph.D. thesis, Lund University, Lund Sweden, 163 p. Lund, M., Lafleur, P.M., Roulet, N.T., Lindroth, A., Christensen, T.R., Aurela, M., Chojnicki, B.H., Flanagan, L.B., Humphreys, E.R., Laurila, T., Oechel, W.C., Olejnik, J., Rinne, J., Schubert, P. and Nilsson, M.B. 2010. Variability in exchange of CO2 across 12 northern peatland and tundra sites. Global Change Biology, 16, 2436–2448. McNeil, P. and Waddington, J.M. 2003. Moisture controls on Sphagnum growth and CO2 exchange on a cutover bog. Journal of Applied Ecology, 40 (2), 354–367. Nellemann, C., Corcoran, E. (eds). 2010. Dead Planet, Living Planet – Biodiversity and Ecosystem Restoration for Sustainable Development. A Rapid Response Assessment. United Nations Environment Programme, GRID-Arendal. Birkeland Trykkeri AS, Norway. P li M R h f L Q i F L i C 200 S i f i d l d i E C d C di J l f B 83 39 Poulin, M., Rochefort, L., Quinty, F., Lavoie, C 2005. Spontaneous revegetation of mined peatlands in Eastern Canada. Canadian Journal of Botany 83, 539- 557. Price, J.S. and Whitehead, G.S. 2004. The influence of past and present hydrological conditions on Sphagnum recolonization and succession in a block-cut bog, Québec. Hydrological Processes, 18 (2), 315–328. Quinty, F. and Rochefort L. 2003. Peatland Restoration Guide, second edition. Canadian Sphagnum Peat Moss Association and New Brunswick Department f N t l R d E Q éb Q éb
Strack, M. (ed.) 2008. Peatlands and Climate Change . International Peat Society, Saarijärven Of fset Oy, Saarijärvi, Finland. Waddington, J.M., Warner, K.D., and Kennedy, G.W. 2002. Cutover peatlands: A persistent source of atmospheric CO2, Global Biogeochemical Cycles, 16(1), 1002. Waddington J M and Day S M 2007 Methane emissions from a peatland following restoration Journal of Geophysical Research G: Waddington, J.M. and Day, S.M. 2007. Methane emissions from a peatland following restoration. Journal of Geophysical Research G: Biogeosciences, 112 (3), art. no. G03018. Waddington, J.M., Tóth, K., Bourbonniere, R. 2008. Dissolved organic carbon export from a cutover and restored peatland. Hydrological Processes, 22 (13) 2215–2224.
Page 18
Page 19