
Evaluation of the anthropogenic Evaluation of the anthropogenic impact on surface water systems: impact on surface water systems: case of Lower Arges Basin, case of Lower Arges Basin, Romania Romania
Elfrida M. Carstea*, Gabriela Pavelescu*, Cristian Ioja** and Elfrida M. Carstea*, Gabriela Pavelescu*, Cristian Ioja** and Luminita Cristescu* Luminita Cristescu*
* National Institute of R&D for Optoelectronics, Magurele, RO * National Institute of R&D for Optoelectronics, Magurele, RO-
- 077125, Romania
077125, Romania (E (E-
- mail:
mail: frida@inoe.inoe.ro frida@inoe.inoe.ro; ; gpavel@inoe.inoe.ro gpavel@inoe.inoe.ro; ; cristescu@inoe.inoe.ro cristescu@inoe.inoe.ro) ) ** University of Bucharest, Centre for Environmental Research an ** University of Bucharest, Centre for Environmental Research and Impact, d Impact, Bucharest, Romania (E Bucharest, Romania (E-
- mail:
mail: cristi@portiledefier.ro cristi@portiledefier.ro) )
Purpose of the study
- Evaluate the degree of contamination with sewage
water:
- Bucharest sewage water
- NO wastewater treatment facility
- Potential to use fluorescence spectroscopy for
sewage water detection
Introduction Methodology Results Conclusions
Fluorescence spectroscopy – pros & cons
- Fast
- Sensitive
- Small quantities of sample
- No sample pretreatment
- Correlates with standard
methods
- Qualitative
- Influenced by external
factors
- Only organic
contamination
No continuous monitoring fluorescence – based instrument
Introduction Methodology Results Conclusions
Principles of fluorescence
Absorption 10-15 s Internal conversion 10-12 s
- Excitation spectra are mirror images of the emission spectra
- Emission has lower energy compared to absorption
S0 S1 S2
Fluorescence 10-9 s
Introduction Methodology Results Conclusions
Fluorescence spectra
- Emission spectrum
- Excitation spectrum
- Synchronous fluorescence spectrum
- Excitation – emission matrix
abscissa – excitation wavelength
- rdinati - emission wavelength
- Synchronous fluorescence map
250 300 350 400 450 500 550 0.0 0.2 0.4 0.6 0.8 1.0
Intensity (a.u.) Wavelength (nm) Polluted water
Introduction Methodology Results Conclusions
300 350 400 450 500 50 100 150 200 Wavelength (nm) Intensity (a.u.) 300 350 400 450 500 50 100 150 200 250 Wavelength (nm) Intensity (a.u.) 300 350 400 450 500 50 100 150 200 Wavelength (nm) Intensity (a.u.) 300 350 400 450 500 50 100 150 200 250 300 Wavelength (nm) Intensity (a.u.) 300 350 400 450 500 100 200 300 400 500 Wavelength (nm) Intensity (a.u.) 300 350 400 450 500 100 200 300 400 500 Wavelength (nm) Intensity (a.u.) 300 350 400 450 500 200 400 600 800 Wavelength (nm) Intensity (a.u.) 300 350 400 450 500 100 200 300 400 500 600 700 Wavelength (nm) Intensity (a.u.) 300 350 400 450 500 200 400 600 800 Wavelength (nm) Intensity (a.u.) 300 350 400 450 500 200 400 600 Wavelength (nm) Intensity (a.u.) 300 350 400 450 500 200 400 600 800 Wavelength (nm) Intensity (a.u.) 300 350 400 450 500 20 40 60 80 100 120 140 Wavelength (nm) Intensity (a.u.) 300 350 400 450 500 20 40 60 80 100 120 Wavelength (nm) Intensity (a.u.) 300 350 400 450 500 20 40 60 80 100 120 Wavelength (nm) Intensity (a.u.) 300 350 400 450 500 20 40 60 80 100 Wavelength (nm) Intensity (a.u.) 300 350 400 450 500 20 40 60 80 100 120 140 Wavelength (nm) Intensity (a.u.) 300 350 400 450 500 200 400 600 800 Wavelength (nm) Intensity (a.u.) 300 350 400 450 500 200 400 600 800 1000 Wavelength (nm) Intensity (a.u.) 300 350 400 450 500 200 400 600 800 1000 Wavelength (nm) Intensity (a.u.) 300 350 400 450 500 200 400 600 800 1000 Wavelength (nm) Intensity (a.u.) 300 350 400 450 500 200 400 600 800 1000 Wavelength (nm) Intensity (a.u.) 300 350 400 450 500 200 400 600 800 1000 Wavelength (nm) Intensity (a.u.) 300 350 400 450 500 200 400 600 800 1000 Wavelength (nm) Intensity (a.u.) 300 350 400 450 500 200 400 600 800 1000 Wavelength (nm) Intensity (a.u.) 300 350 400 450 500 200 400 600 800 1000 Wavelength (nm) Intensity (a.u.) 300 350 400 450 500 200 400 600 800 1000 Wavelength (nm) Intensity (a.u.) 300 350 400 450 500 200 400 600 800 1000 Wavelength (nm) Intensity (a.u.) 300 350 400 450 500 200 400 600 800 1000 Wavelength (nm) Intensity (a.u.) 300 350 400 450 500 200 400 600 800 1000 Wavelength (nm) Intensity (a.u.) 300 350 400 450 500 200 400 600 800 1000 Wavelength (nm) Intensity (a.u.) 300 350 400 450 500 200 400 600 800 1000 Wavelength (nm) Intensity (a.u.) 300 350 400 450 500 200 400 600 800 1000 Wavelength (nm) Intensity (a.u.) 300 350 400 450 500 200 400 600 800 1000 Wavelength (nm) Intensity (a.u.) 300 350 400 450 500 200 400 600 800 1000 Wavelength (nm) Intensity (a.u.) 300 350 400 450 500 200 400 600 800 1000 Wavelength (nm) Intensity (a.u.) 300 350 400 450 500 200 400 600 800 1000 Wavelength (nm) Intensity (a.u.) 300 350 400 450 500 200 400 600 800 1000 Wavelength (nm) Intensity (a.u.) 300 350 400 450 500 200 400 600 800 1000 Wavelength (nm) Intensity (a.u.) 300 350 400 450 500 200 400 600 800 1000 Wavelength (nm) Intensity (a.u.) 300 350 400 450 500 200 400 600 800 1000 Wavelength (nm) Intensity (a.u.) 300 350 400 450 500 200 400 600 800 1000 Wavelength (nm) Intensity (a.u.) W a v e l e n g t h ( n m ) Wavelength (nm) 200.00 225.00 250.00 275.00 300.00 325.00 350.00 375.00 400.00
300.00 325.00 350.00 375.00 400.00 425.00 450.00 475.00 500.00 962.48 887.43 812.38 737.33 662.28 587.23 512.18 437.13 362.09 287.04 211.99 136.94 61.89- 13.16
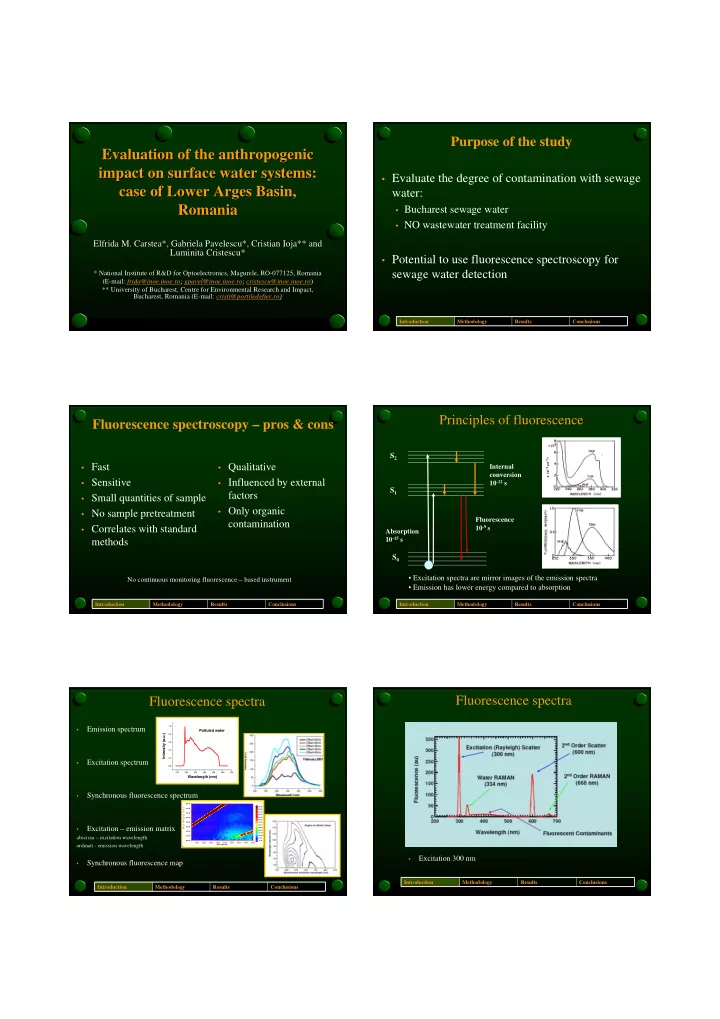
Fluorescence spectra
- Excitation 300 nm
Introduction Methodology Results Conclusions