
SLIDE 1
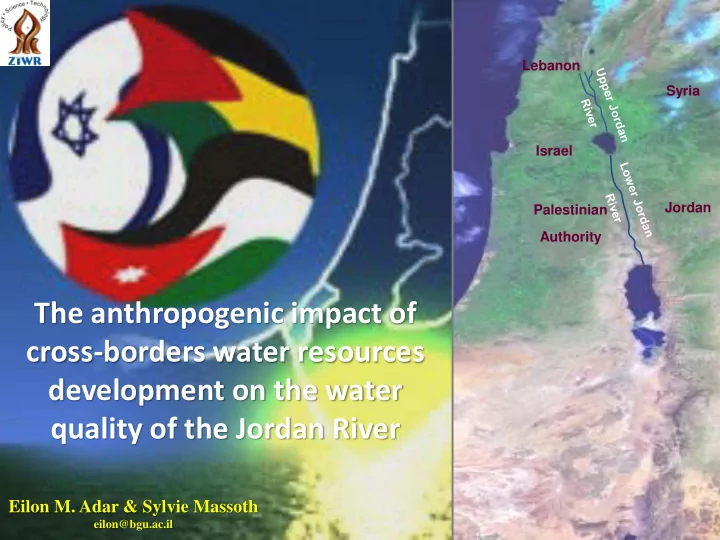
Israel Syria Palestinian Authority Lebanon Jordan
The anthropogenic impact of cross-borders water resources development on the water quality of the Jordan River
Eilon M. Adar & Sylvie Massoth
eilon@bgu.ac.il
The anthropogenic impact of cross-borders water resources - - PowerPoint PPT Presentation
Lebanon Syria Israel Jordan Palestinian Authority The anthropogenic impact of cross-borders water resources development on the water quality of the Jordan River Eilon M. Adar & Sylvie Massoth eilon@bgu.ac.il The Sea of Galilee - The only
Israel Syria Palestinian Authority Lebanon Jordan
Eilon M. Adar & Sylvie Massoth
eilon@bgu.ac.il
Sea of Galilee Yarmuk River
The Jordan River basin is a cross-borders trans-boundary basin shared by Lebanon, Syria, Jordan, Palestinian Authority and Israel. Salt & brines carrier 20M/y Upper Jordan river 500-600M/y Flood in the Yarmuk river 250-550M/y
Jordan River Jordan River
80-120M/y 250-350M/y National water carrier 250-350M/y
Sea of Galilee Dead Sea
North South Central
Sea of Galilee Dead Sea
Sewage+ Brines 27 Amman waste water 30-40 Irrigation 60-70 MCM Sea of Galilee Dead Sea King Talal dam Irrigation from west ~30 MCM
Adasiya D. King Abdalla Canal (~150)
Sea
Galilee
Dead Sea
The Mixing Cells Modeling (MCM) concept Water Balance Expression
1 1 1
) 1 (
n n J j nj R r I i in rn
S W q q Q
n n n
All potential sources are identified
n n n J j nj R r I i in rn
n n n
1 1 1
) 2 (
Leakage from the clay & marls formations
Wn
nk I i J j n n nj nk in ink R r rn rk
1 1 1
) 3 (
rn rkQ
C
ink
ink
nk
Every source is designated by a unique hydro-chemical composition
nK I i J j n n nj nK in inK R r rn rK nk I i J j n n nj nk in ink R r rn rk nk I i J j n n nj nk in ink R r rn rk nk I i J j n n nj nk in ink R r rn rk n n J j nj R r I i in rn
n n n
1 1 1 1 1 1 1 1 1 1 1 1 1 1 1
3 3 3 3 2 2 2 2 1 1 1 1
) 4 (
Mass Balance Expressions Water Balance Expression
n J n I n R K
nK nK InK nK i nK i RnK nK r nK r nk nk Ink nk i nk i Rnk nk r nk r nk nk Ink nk i nk i Rnk nk r nk r n
C C C C C C C C C C C C C C C C C C C C C C C C C
1 2 1 2 1 2 2 2 2 2 2 1 2 2 2 2 1 1 1 1 1 2 1 1 1 1 2 1 1
, , , , , , , , , , , , , , , , , , , , , , , , , , , , , , 1 , , 1 , 1 , , 1 , 1 , 1 , , 1 , 1
) 6 (
1 ) 7 (
2 1 2 1 2 1
n J n I n R
n n n
nJ nj nj I i i R r r n
q q q q q q Q Q Q X
1 1 ) 8 (
3 2 1
K
n n nK n n nk n n nk n n nk n n n
S W C S W C S W C S W C S W P
1 1 ) 9 (
3 2 1
K
nK nk nk nk n n
E
N n n n n n n n N n n T
1 1
) (10
Uri Shavit
Technion, Haifa, Israel
Avner Vengosh
Ben Gurion University, Israel Duke University, NC USA Hydro-chemical & Isotopes Data
Efrat Farber
Ben Gurion University, Israel
River input Cell
JR-67 –Yarmouk River
JR-70 JR-69 JR-68 JR-68 A JR-64 Cell-65 JR-62 JR-54 B1 B4 B6 Bore hole
Farber et al. 2004
JR
River input Cell Source Cell
Cell
Cell
Cell
Cell
MCM Results for single compartments/segments along the Lower Jordan Valley
Average hydro-chemical and isotopic data for the winter (September 2000-February 2001) and summer (March 2001-August 2001). Alumot Bridge
1 Cell
Cell Source winter 00-01 summer 01 %cell inflow % diff. %cell inflow % diff. Cell_4 Gesher 1.60% 3.32% Cell_3 77.3 97.2 W.Surf.Inflow_12 5
22.7 2.93
Zur el mandase Allenby Bridge Gilgal Adam Bridge Zarzir Station 79.5% Zarqa River 6.3 Aqraa .6% Abu Mayyala 4.5% Mallah Gdeida 7.9% Wadi el Ah'mar 0.6% Uga Melecha 0.1% Rassif 0.6% Mallaha
103.1
Gibton 21.3% Zur el mandase Allenby Bridge Gilgal Tovlan Station Adam Bridge Rajib Seebiya Zarqa River 14.9% Aqraa 0.2%, 0.3% Abu Mayyala 5.1% Tirtcha Uper 11.8% Wadi el Ah'mar 0.2% Mallaha 1.3%, 1.1% Uga Melecha 22.0%, 18.5% Wadi Hawwaya 0.8% Mallah Gdeida 2.6%