
SLIDE 1
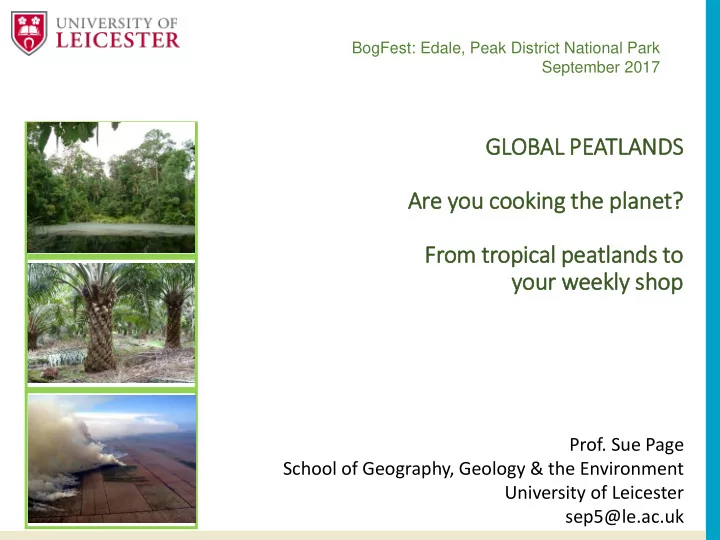
GLOBAL PEATLANDS Are you cooking th the pla lanet? From tr tropical peatlands to your weekly sh shop
- Prof. Sue Page
School of Geography, Geology & the Environment University of Leicester sep5@le.ac.uk
International Conference in Biodiversity, UNTAN – October 2016 BogFest: Edale, Peak District National Park September 2017