SLIDE 1
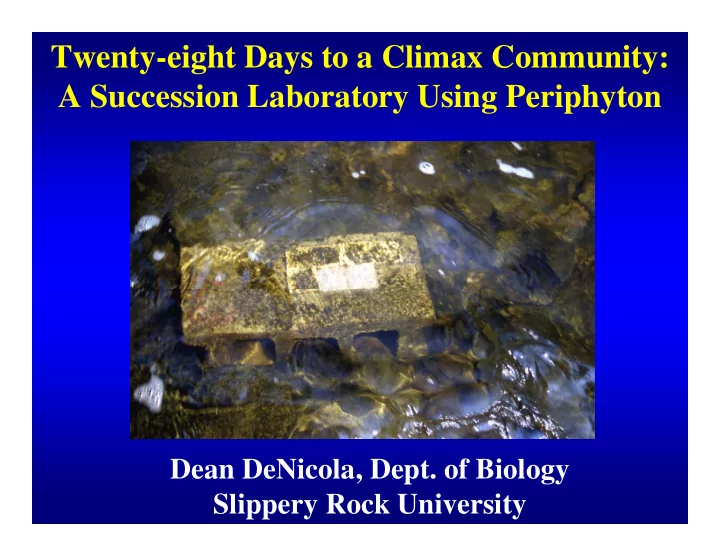
Twenty-eight Days to a Climax Community: A Succession Laboratory Using Periphyton
Dean DeNicola, Dept. of Biology Slippery Rock University
SLIDE 2 Why Use Freshwater Periphyton?
- Rapid reproduction rates means
succession occurs in a matter of weeks not decades
- Repeated Measures method is more
intuitive for understanding succession than chronosequence
- Involves the concept of species guilds
(growth forms) and conceptual models in community ecology
SLIDE 3 Lab Outcomes:
- To contrast periphyton succession in a
lake and stream based on changes in taxonomic composition
- To compare successional changes in algal
growth forms to published models
- To understand mechanisms of succession
proposed by Connel & Slatyer and explain how they might apply to this study
- To increase awareness and become
familiar with different types of algae
SLIDE 4
Unglazed clay tiles attached with silicone adhesive to cement blocks
SLIDE 5 Students (or you) place blocks in high irradiance areas in a stream and in a pond or lake about 0.25 m deep Remove tiles and scrape with brush
and 28
SLIDE 6
Day 8
SLIDE 7
Day 16
SLIDE 8
Day 28
SLIDE 9
Students count and ID about 200 taxa (genus and growth form) from wet mounts at 400X
SLIDE 10
SLIDE 11 Useful Taxonomic References To Make Up Your Own Picture Key
- 1971. C.I. Weber. A guide to the common
diatoms at water pollution surveillance system
- stations. EPA.
- 1988. J. Needham. A guide to the study of
freshwater biology. McGraw Hill.
- 1996. E. Cox. Identification of freshwater
diatoms from live material. Chapman & Hall.
- 1997. T.J. Entwisle et. al. Freshwater Algae in
- Australia. Sainty and Assoc.
- 2000. M. Kelly. Identification of common benthic
diatoms in rivers. Field Studies Council.
SLIDE 12
Other ID Aids: Photos of common taxa Power Point presentation with images from the web
SLIDE 13
Growth Forms: *Prostrate *Erect immobile *Stalked *Motile *Chain *Colonial prostate greens and BG’s *Filamentous greens *BG filaments Lake growth form model (Hoagland et al. 1982)
SLIDE 14
Stream growth form model based on (Hudon and Bourget 1983)
SLIDE 15
Students enter their counts into a Excel file and the data is pooled for the class
SLIDE 16 Diatoma Synedra Other Oscillatoria Navicula Stigeoclonium Melosira Gomphonema
Day 4 Day 8 Day 16 Day 28
Stream Taxa
SLIDE 17 Filamentous cyanobacteria Erect immobile Other Diatom chain Prostrate Filamentous greens Stalked diatom Motile diatoms
Day 4 Day 8 Day 16 Day 28
Stream Growth Forms
Stream Growth Forms
SLIDE 18 Unicellular greens Synedra Other Oedogonium Melosira Scenedesmus/Ankistro. Cymbella Navicula
Day 4 Day 8 Day 16 Day 28
Pond Taxa
SLIDE 19 Unicellular/col. greens Erect immobile Other Diatom chain Prostrate Filamentous greens Stalked diatom Motile diatoms
Day 4 Day 8 Day 16 Day 28
Pond Growth Forms
Pond Growth Forms
SLIDE 20 Lab Report
- Presentation of changes in taxonomic structure
and growth forms in properly constructed figures
- Discussion of successional sequence, contrasting
differences in the lake and stream
- Do the changes in growth form fit the
generalized models for lakes and streams?
- Discuss how Connel and Slatyer models may
apply, and how you would test the models
SLIDE 21 Possible Modifications
- Compare succession in areas of different
light or current speed
- Compare succession with and without
grazers using an exclosure
- Determine relative changes in cell
density during succession by scraping the same area & bringing samples up to the same volume. Students pipette a known volume onto their slide and count a given number of transects on the slide
SLIDE 22
Diatoms = Good student evaluations