
SLIDE 1
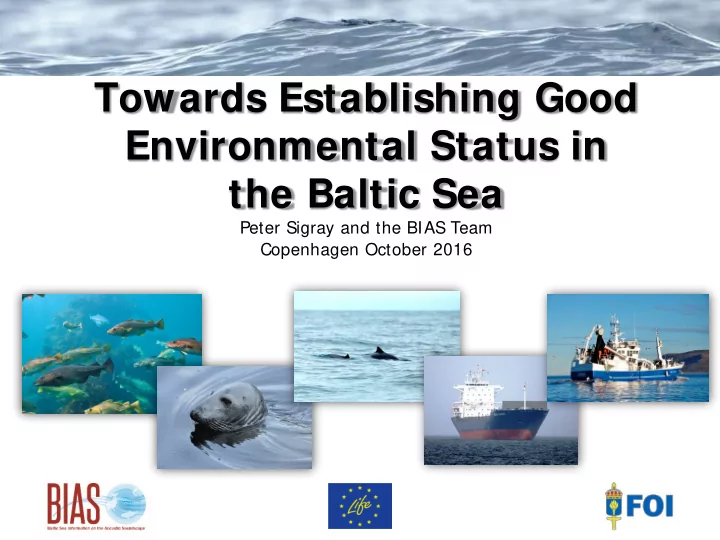
Towards Establishing Good Environmental Status in the Baltic Sea
Peter Sigray and the BIAS Team Copenhagen October 2016
Towards Establishing Good Environmental Status in the Baltic Sea - - PowerPoint PPT Presentation
Towards Establishing Good Environmental Status in the Baltic Sea Peter Sigray and the BIAS Team Copenhagen October 2016 Good Environmental Status According to European Union The environmental status allow: o full ecosystem function o
Towards Establishing Good Environmental Status in the Baltic Sea
Peter Sigray and the BIAS Team Copenhagen October 2016
Good Environmental Status According to European Union
The environmental status allow:
Species and habitats are protected, biodiversity is maintained, biological components function in balance
Indicator D11.2 The TG-Noise clarification Continuous noise is mainly about masking
A EU-LIFE project: The first large scale attempt to implement management of noise
Develop regional standards
Large-scale Measurement
Modelling of Soundscape
Soundscape planning tool
Perform measurements in a standardized way at 37 locations for one year Visit each position up to five times over a 15 month period
To extend the results to the full Baltic Sea acoustic modeling was performed using the measured data for “calibrating” the model
Soundscape maps for management
0 – 15 m 30 – bottom Full depth
63 Hz 5 percentile 10 percentile 25 percentile 50 percentile 75 percentile 90 percentile 95 percentile
In total: 21 maps per frequency and month, 63, 125 and 2000 Hz
Total: 757 maps
125 Hz 5 percentile 10 percentile 25 percentile 50 percentile 75 percentile 90 percentile 95 percentile 2000 Hz 5 percentile 10 percentile 25 percentile 50 percentile 75 percentile 90 percentile 95 percentile
We have to relate to the fact that modelling of the ambient soundscape generates maps
Depth dependence Frequency dependence Monthly Percentiles Areal coverage Temporal coverage We identified that these variables are important And they result in two representations
The Soundscape Planning Tool or how to use 757 soundscape maps to manage the Baltic Sea
Assume that we state that the threshold is 82 dB
species are residing
than 82 dB. How large sonified area can we accept, 50%?
82 dB during a portion of the TIME, can we accept 25%?
82 dB
5% of time 50% of time 95% of time
SSA: The Proportion of Area for which a Sound Level is exceeded a certain percentage of time
82 dB
5% of time 50% of time 95% of time
TSA: The Proportion of Area for which a Sound Level is exceeded a certain percentage as a function of time
Two useful to representation of noise based on n:th percentile
Spatially Sonified Area (SSAn) Temporally Sonified Area (TSAn)