Investigating a proactive approach for bicyclists safety by using - - PDF document

investigating a proactive approach for bicyclists safety
SMART_READER_LITE
LIVE PREVIEW

Investigating a proactive approach for bicyclists safety by using - - PDF document

International Co-operation on Theories and Concepts in Traffic safety (ICTCT) Proactive approach 2425 th October 2019, Warsaw, POLAND Investigating a proactive approach for bicyclists safety by using GPS data Conceptual Safety Pyramid


slide-1
SLIDE 1

Sylwia POGODZINSKA Mariusz KIEC Cracow University of Technology

Investigating a proactive approach for bicyclists safety by using GPS data

International Co-operation on Theories and Concepts in Traffic safety (ICTCT) 24–25th October 2019, Warsaw, POLAND
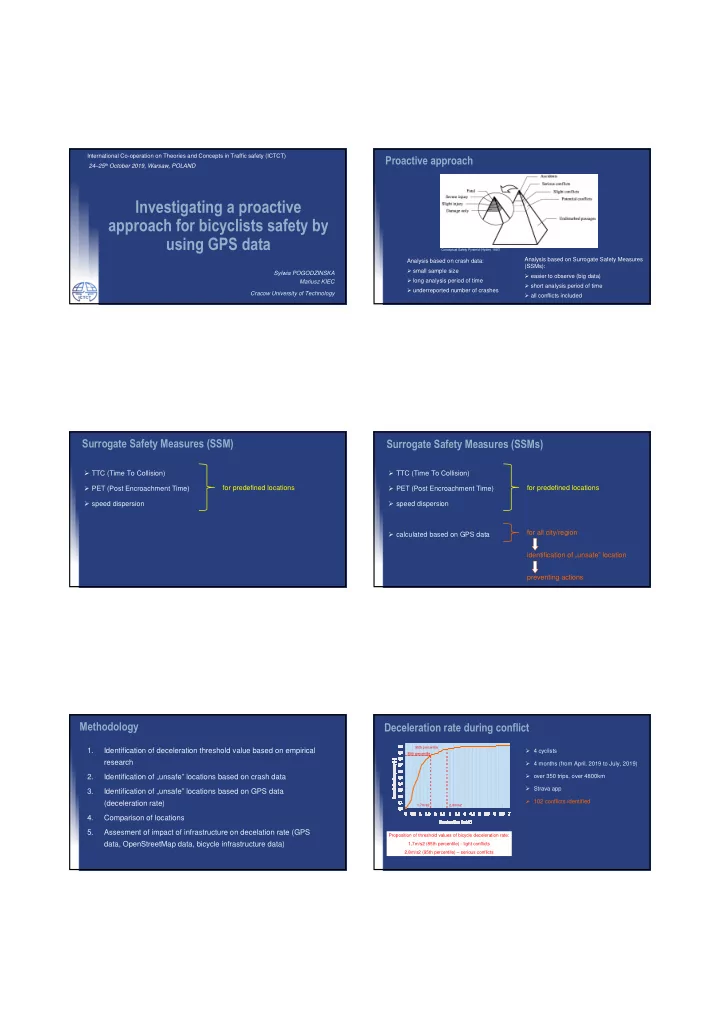
Proactive approach

Analysis based on crash data: small sample size long analysis period of time underreported number of crashes

Conceptual Safety Pyramid (Hyden, 1987).

Analysis based on Surrogate Safety Measures (SSMs): easier to observe (big data) short analysis period of time all conflicts included

Surrogate Safety Measures (SSM)

TTC (Time To Collision) PET (Post Encroachment Time) speed dispersion for predefined locations

Surrogate Safety Measures (SSMs)

TTC (Time To Collision) PET (Post Encroachment Time) speed dispersion calculated based on GPS data for predefined locations for all city/region identification of „unsafe” location preventing actions

Methodology

1. Identification of deceleration threshold value based on empirical research 2. Identification of „unsafe” locations based on crash data 3. Identification of „unsafe” locations based on GPS data (deceleration rate) 4. Comparison of locations 5. Assesment of impact of infrastructure on decelation rate (GPS data, OpenStreetMap data, bicycle infrastructure data)

Deceleration rate during conflict

4 cyclists 4 months (from April, 2019 to July, 2019)

  • ver 350 trips, over 4800km

Strava app 102 conflicts identified

Proposition of threshold values of bicycle deceleration rate: 1,7m/s2 (85th percentile) - light conflicts 2,8m/s2 (95th percentile) – serious conflicts

1,7m/s2 2,8m/s2 95th percentile 85th percentile

slide-2
SLIDE 2

Deceleration rate during conflict

4 cyclists 4 months (from April, 2019 to July, 2019)

  • ver 350 trips, over 4800km

Strava app 102 conflicts identified

Proposition of threshold values of bicycle deceleration rate: 1,7m/s2 (85th percentile) - light conflicts 2,8m/s2 (95th percentile) – serious conflicts CROW threshold values of bicycle deceleration rate: 1,5 m/s2 – comfortable braking (80th percentile) 2,6 m/s2 – emergency braking (94th percentile)

1,7m/s2 2,8m/s2 95th percentile 85th percentile

Crash data

  • 4 years (2014-2017)
  • 938 injured crashes and 669 PDO (Property

Damage Only) crashes with cyclists (1607 in total) „Unsafe” location - where 4 or more crashes occurred (at least 1 per year on average) 25 „unsafe” locations identified 138 (8,6%) crashes with cyclists (92 injured crashes, 46 PDO)

Bikeshare system data (Wavelo)

Wavelo bikes (source: www.lovekrakow.pl) Acceleration [m/s2] Number of occurance

„Unsafe” location - where 2 or more conflicts occurred

  • 148 375 trips made in June, 2017
  • 108 conflicts in total

12 „unsafe” locations identified 42 conflicts (39%) Conflict - emergency braking with deceleration ≥ 2,6m/s2

Comparison

Why?

accuracy of GPS devices (e.g. signal disruptions) impact of infrastructure (eg. visibility obstacles, traffic phases design) analysis based od GPS data can show locations where conflicts between cyclists and pedestrians occure (often not included in crash data)

Assesment of impact of infrastructure

Bicycle GPS data Conflicts (1,5m/s2< dec.<7,0m/s2) Bicycle infrastructure data OpenStreetMap data

(eg. shops, bus stops, street lamps, parks, universities, hotels, restaurants)

Impact of infrastructure

Results

slide-3
SLIDE 3

Conclusions

using GPS data is a promising method in proactive approach for cyclists safety, more indepth research should be done to investigate which SSMs and what threshold values should be adopted in analysis for different data sources, SSMs and crash data should be both taken into consideration in decision making process, necessity of combining deceleration data with other affecting cyclists safety

Thank you for your attention

Contact: Sylwia POGODZINSKA Cracow University of Technology Faculty of Civil Engineering spogodzinska@pk.edu.pl