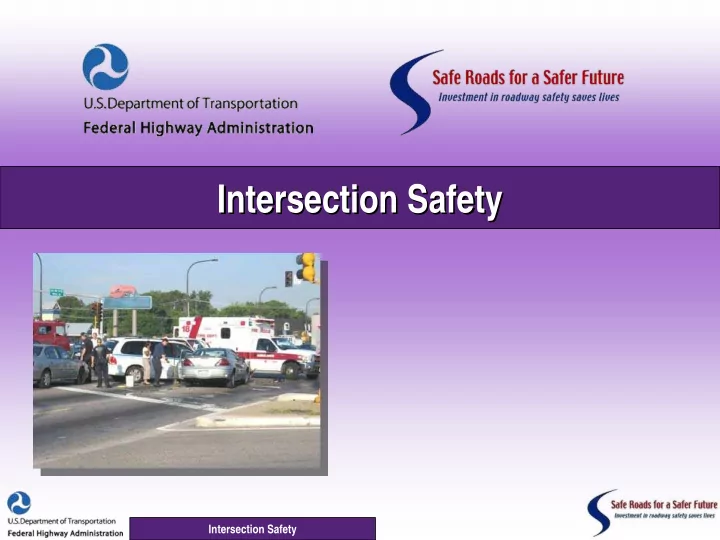
Intersection Safety Intersection Safety Intersection Safety FHWA - - PowerPoint PPT Presentation

intersection safety intersection safety
SMART_READER_LITE
LIVE PREVIEW

Intersection Safety Intersection Safety Intersection Safety FHWA - - PowerPoint PPT Presentation

Intersection Safety Intersection Safety Intersection Safety FHWA Safety Focus Areas FHWA Safety Focus Areas Intersection Safety Intersection Safety 2 Intersections Intersections Intersection Safety Intersection Safety 3 Intersections


slide-1
SLIDE 1

Intersection Safety

Intersection Safety Intersection Safety

slide-2
SLIDE 2

Intersection Safety Intersection Safety

FHWA Safety Focus Areas FHWA Safety Focus Areas

2

slide-3
SLIDE 3

Intersection Safety Intersection Safety 3

Intersections Intersections

slide-4
SLIDE 4

Intersection Safety Intersection Safety

Intersections Intersections

  • Among the most hazardous components of the

highway system for all users (planned points of conflict)

  • Complex speed-distance

judgments under time constraints

  • Interstates (full access

control) have fatality rates less than half of other highway types

slide-5
SLIDE 5

Intersection Safety Intersection Safety

National Statistics National Statistics

5

slide-6
SLIDE 6

Intersection Safety Intersection Safety

National Statistics National Statistics

6

Non-Intersections 79% Intersections 21%

There were 41,059 highway fatalities There were 41,059 highway fatalities in 2007. Where did they occur? in 2007. Where did they occur? About half of About half of all all crashes and crashes and half of all injury crashes half of all injury crashes

  • ccur at intersections.
  • ccur at intersections.
slide-7
SLIDE 7

Intersection Safety Intersection Safety

Intersection Fatalities Intersection Fatalities

7

1,000 2,000 3,000 4,000 5,000 6,000 Arterial Collector Local Unknown

5,232 1,472 214 1,739

There were 8,657 intersection fatalities in 2007. There were 8,657 intersection fatalities in 2007. Where did they occur? Where did they occur? 39% in 39% in rural areas rural areas 61% in 61% in urban areas urban areas

Fatalities

slide-8
SLIDE 8

Intersection Safety Intersection Safety

Intersection Fatalities Intersection Fatalities

8

slide-9
SLIDE 9

Intersection Safety Intersection Safety

State Statistics State Statistics

9

31 31 27 27 6 71 71 27 27 15 15 52 52 193 193 235 235 455 455 181 181 117 117 152 152 113 113 71 71 780 780 235 235 96 96 267 267 13 13 41 41 300 300 142 142 23 23 342 342 26 26 292 292 100 100 77 77 578 578 251 251 142 142 180 180 956 956 154 154 167 167 102 102 39 39 123 123 9 58 58 160 160 15 15 94 94 100 100 240 240 33 33 150 150 122 122 28 28 21 21 (DC

(DC)

X = # of fatal crashes in 2007 classified as intersection or intersection-related X = # of fatal crashes in 2007 classified as intersection or intersection-related

slide-10
SLIDE 10

Intersection Safety Intersection Safety

State Statistics State Statistics

10

25% 25% 35% 35% 10% 10% 18% 18% 23% 23% 23% 23% 21% 21% 24% 24% 35% 35% 37% 37% 19% 19% 23% 23% 33% 33% 21% 21% 18% 18% 22% 22% 24% 24% 25% 25% 23% 23% 14% 14% 16% 16% 27% 27% 22% 22% 22% 22% 24% 24% 15% 15% 22% 22% 16% 16% 34% 34% 20% 20% 17% 17% 29% 29% 17% 17% 33% 33% 17% 17% 17% 17% 27% 27% 18% 18% 16% 16% 7% 7% 16% 16% 18% 18% 12% 12% 28% 28% 17% 17% 26% 26% 9% 9% 15% 15% 15% 15% 11% 11% 58% 58% (DC)

(DC)

X = % of fatal crashes in 2007 classified as intersection or intersection-related X = % of fatal crashes in 2007 classified as intersection or intersection-related

slide-11
SLIDE 11

Intersection Safety Intersection Safety

Red Light Running Red Light Running

11

slide-12
SLIDE 12

Intersection Safety Intersection Safety

Pedestrians Pedestrians

12

Total = 1,152*

* Includes 9 “age unknown”

slide-13
SLIDE 13

Intersection Safety Intersection Safety

Bicyclists Bicyclists

13

Total = 266*

* Includes 2 “age unknown”

slide-14
SLIDE 14

Intersection Safety Intersection Safety

State Statistics State Statistics

14

12 12 10 10 17 17 6 4 9 15 15 81 81 179 179 31 31 27 27 15 15 21 21 22 22 218 218 26 26 7 28 28 1 12 12 64 64 14 14 1 30 30 3 48 48 2 2 57 57 16 16 22 22 13 13 207 207 18 18 13 13 4 8 8 13 13 25 25 17 17 9 54 54 2 5 5 3 14 14 (DC

(DC)

X X = # of pedestrian and bicycle fatalities in 2007 classified as intersection or intersection-related X X = # of pedestrian and bicycle fatalities in 2007 classified as intersection or intersection-related

slide-15
SLIDE 15

Intersection Safety Intersection Safety

Typical Intersection Crash Types Typical Intersection Crash Types

15

slide-16
SLIDE 16

Intersection Safety Intersection Safety

Crash Type Distribution Crash Type Distribution

16

slide-17
SLIDE 17

Intersection Safety Intersection Safety

Nominal and Substantive Safety Nominal and Substantive Safety

17

slide-18
SLIDE 18

Intersection Safety Intersection Safety

  • Two-lane highway with inadequate SSD
  • Nominal safety design advance warning sign

– But may still have high number of right-angle crashes

Nominal and Substantive Safety Nominal and Substantive Safety

18

slide-19
SLIDE 19

Intersection Safety Intersection Safety

  • Substantive safety additional advance sign

Nominal and Substantive Safety Nominal and Substantive Safety

19

slide-20
SLIDE 20

Intersection Safety Intersection Safety

Crash Reduction Factors Crash Reduction Factors

  • http://safety.fhwa.dot.gov/tools/crf/

20

FHWA Report Center: report.center@dot.gov FHWA Report Center: report.center@dot.gov

slide-21
SLIDE 21

Intersection Safety Intersection Safety

Techniques for Improving Safety Techniques for Improving Safety

  • Increase visibility of intersections and traffic

control devices

  • Increase awareness of intersections
  • Improve the design of intersections to reduce

conflicts

  • Improve driver comprehension to reduce

confusion

  • Improve the operations of intersections
  • Improve sight distance at intersections
  • Improve driver compliance with traffic control

devices

21

slide-22
SLIDE 22

Intersection Safety Intersection Safety

Increasing Visibility Increasing Visibility

22

One signal head per lane Backplates 12” Lenses

slide-23
SLIDE 23

Intersection Safety Intersection Safety

Increasing Visibility Increasing Visibility

23

Oversized Signs Street lights

slide-24
SLIDE 24

Intersection Safety Intersection Safety

Increasing Awareness Increasing Awareness

24

Advance warning Splitter islands Pavement markings

slide-25
SLIDE 25

Intersection Safety Intersection Safety

Improving Design Improving Design

25

New alignment New alignment

Roundabouts Reduce skew Turn lanes

slide-26
SLIDE 26

Intersection Safety Intersection Safety

Improving Design Improving Design

26

Access management Close driveways

slide-27
SLIDE 27

Intersection Safety Intersection Safety

Improving Comprehension Improving Comprehension

27

Overhead signing Turn markings

slide-28
SLIDE 28

Intersection Safety Intersection Safety

Improving Operations Improving Operations

28

Change intervals Coordination Phasing

slide-29
SLIDE 29

Intersection Safety Intersection Safety

Improving Operations Improving Operations

29

Turn restrictions Countdown signals Signal removal

slide-30
SLIDE 30

Intersection Safety Intersection Safety

Improving Sight Distance Improving Sight Distance

30

Clear sight triangles Offset turn lanes

slide-31
SLIDE 31

Intersection Safety Intersection Safety

Improving Compliance Improving Compliance

31

Enforcement lights Traditional Automated

slide-32
SLIDE 32

Intersection Safety Intersection Safety 32

Information and Education Information and Education

Web sites Web sites Web sites Printed material Printed material Printed material Speed trailers Speed trailers Speed trailers Community outreach Community outreach Community outreach In school programs In school programs In school programs Radio and TV Radio and TV Radio and TV

slide-33
SLIDE 33

Intersection Safety Intersection Safety

Intersection Safety Action Plan Intersection Safety Action Plan

33

Provides guidance on how to identify and systematically deploy cost-effective, publicly acceptable safety strategies that will result in a substantial statewide reduction of intersection fatalities and serious injuries.

slide-34
SLIDE 34

Intersection Safety Intersection Safety

On On-

  • Going Research

Going Research

34

  • Speed reduction at two-way stop-controlled intersections with lane narrowing

using rumble strips

  • An informational report on four alternative/innovative intersections and two

alternative interchanges

  • Surrogate safety assessment model using traffic simulation
  • Better signing of 3-lane roundabouts
  • Field and laboratory studies of the restricted crossing U-turn intersection
  • Field assessment of the detection control system
  • Field evaluation of mini-roundabouts
slide-35
SLIDE 35

Intersection Safety Intersection Safety

Training Opportunities Training Opportunities

  • Signalized Intersection Guidebook Workshop
  • Intersection Safety Workshop
  • Designing and Operating Intersections for Safety
  • Interactive Highway Safety Design Model
  • Roundabout Workshop
  • Low-Cost Safety Improvements Workshop
  • Low-Cost Safety Improvements (Blended Approach)
  • Planning and Designing for Pedestrian Safety
  • Application of Crash Reduction Factors (CRF)
  • Science of Crash Reduction Factors

35

http://nhi.fhwa.dot.gov/

slide-36
SLIDE 36

Intersection Safety Intersection Safety 36

For More Information For More Information

  • FHWA Office of Safety

– http://safety.fhwa.dot.gov/

  • NCHRP Report 500 Series

– http://safety.transportation.org/

  • Manual on Uniform Traffic Control Devices

– http://mutcd.fhwa.dot.gov/

  • Toolbox on Intersection Safety and Design

– http://www.ite.org/