
SLIDE 1
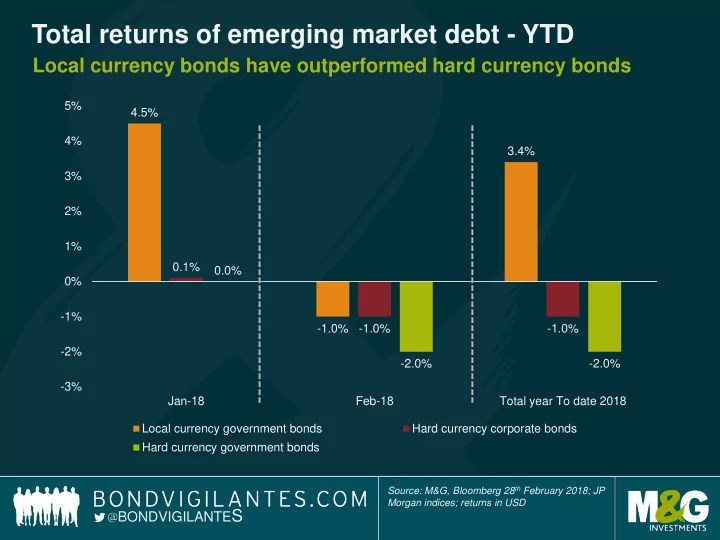
Total returns of emerging market debt - YTD
Local currency bonds have outperformed hard currency bonds
Source: M&G, Bloomberg 28th February 2018; JP Morgan indices; returns in USD
BONDVIGILANTES
4.5%
- 1.0%
3.4% 0.1%
- 1.0%
- 1.0%
0.0%
- 2.0%
- 2.0%
- 3%
- 2%
- 1%
0% 1% 2% 3% 4% 5% Jan-18 Feb-18 Total year To date 2018 Local currency government bonds Hard currency corporate bonds Hard currency government bonds