
SLIDE 1
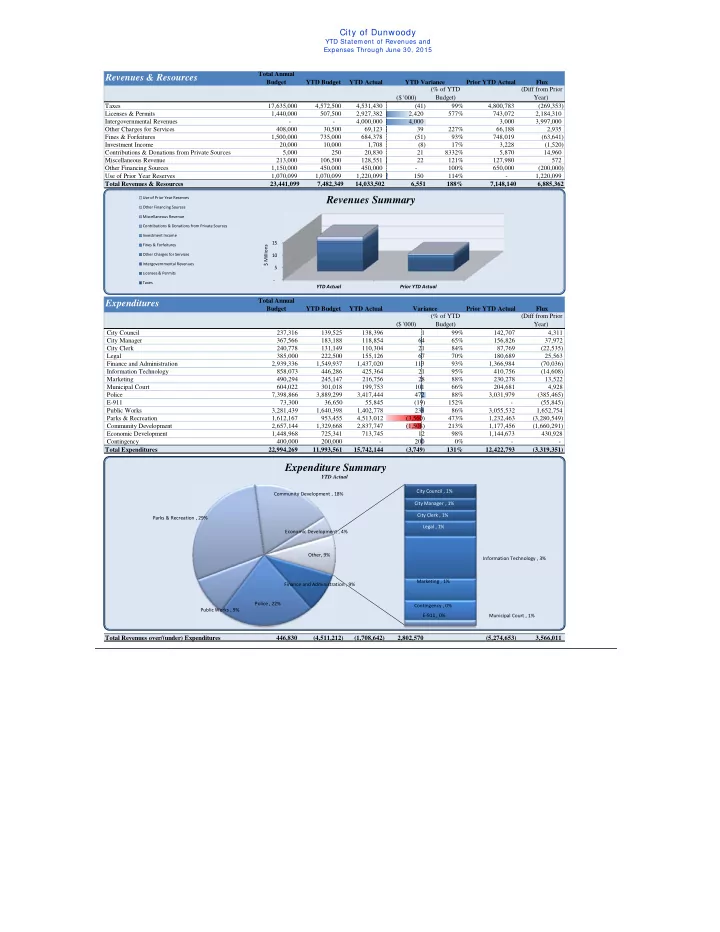
City of Dunwoody
YTD Statement of Revenues and Expenses Through June 30, 2015
Revenues & Resources
Total Annual Budget YTD Budget YTD Actual Prior YTD Actual Flux ($ '000) (% of YTD Budget) (Diff from Prior Year) Taxes 17,635,000 4,572,500 4,531,430 (41) 99% 4,800,783 (269,353) Licenses & Permits 1,440,000 507,500 2,927,382 2,420 577% 743,072 2,184,310 Intergovernmental Revenues
- 4,000,000
4,000 3,000 3,997,000 Other Charges for Services 408,000 30,500 69,123 39 227% 66,188 2,935 Fines & Forfeitures 1,500,000 735,000 684,378 (51) 93% 748,019 (63,641) Investment Income 20,000 10,000 1,708 (8) 17% 3,228 (1,520) Contributions & Donations from Private Sources 5,000 250 20,830 21 8332% 5,870 14,960 Miscellaneous Revenue 213,000 106,500 128,551 22 121% 127,980 572 Other Financing Sources 1,150,000 450,000 450,000
- 100%
650,000 (200,000) Use of Prior Year Reserves 1,070,099 1,070,099 1,220,099 150 114%
- 1,220,099
Total Revenues & Resources 23,441,099 7,482,349 14,033,502 6,551 188% 7,148,140 6,885,362
Expenditures
Total Annual Budget YTD Budget YTD Actual Prior YTD Actual Flux ($ '000) (% of YTD Budget) (Diff from Prior Year) City Council 237,316 139,525 138,396 1 99% 142,707 4,311 City Manager 367,566 183,188 118,854 64 65% 156,826 37,972 City Clerk 240,778 131,149 110,304 21 84% 87,769 (22,535) Legal 385,000 222,500 155,126 67 70% 180,689 25,563 Finance and Administration 2,939,336 1,549,937 1,437,020 113 93% 1,366,984 (70,036) Information Technology 858,073 446,286 425,364 21 95% 410,756 (14,608) Marketing 490,294 245,147 216,756 28 88% 230,278 13,522 Municipal Court 604,022 301,018 199,753 101 66% 204,681 4,928 Police 7,398,866 3,889,299 3,417,444 472 88% 3,031,979 (385,465) E-911 73,300 36,650 55,845 (19) 152%
- (55,845)
Public Works 3,281,439 1,640,398 1,402,778 238 86% 3,055,532 1,652,754 Parks & Recreation 1,612,167 953,455 4,513,012 (3,560) 473% 1,232,463 (3,280,549) Community Development 2,657,144 1,329,668 2,837,747 (1,508) 213% 1,177,456 (1,660,291) Economic Development 1,448,968 725,341 713,745 12 98% 1,144,673 430,928 Contingency 400,000 200,000
- 200
0%
- -
Total Expenditures 22,994,269 11,993,561 15,742,144 (3,749) 131% 12,422,793 (3,319,351) Total Revenues over/(under) Expenditures 446,830 (4,511,212) (1,708,642) 2,802,570 (5,274,653) 3,566,011 YTD Variance Variance
‐ 5 10 15 YTD Actual Prior YTD Actual $ Millions
Revenues Summary
Use of Prior Year Reserves Other Financing Sources Miscellaneous Revenue Contributions & Donations from Private Sources Investment Income Fines & Forfeitures Other Charges for Services Intergovernmental Revenues Licenses & Permits Taxes
City Council , 1% City Manager , 1% City Clerk , 1% Legal , 1% Finance and Administration , 9% Information Technology , 3% Marketing , 1% Municipal Court , 1% Police , 22% E‐911 , 0% Public Works , 9% Parks & Recreation , 29% Community Development , 18% Economic Development , 4% Contingency , 0% Other, 9%
Expenditure Summary
YTD Actual