SLIDE 1 City of Dunwoody
YTD Statement of Revenues and Expenses Through March 31, 2015
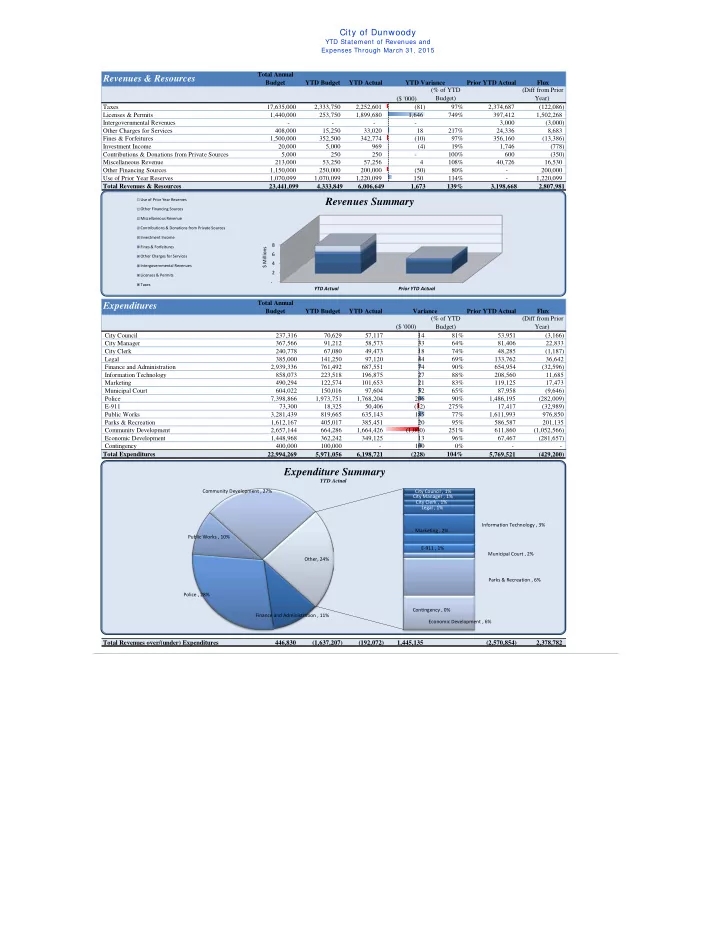
Revenues & Resources
Total Annual Budget YTD Budget YTD Actual Prior YTD Actual Flux ($ '000) (% of YTD Budget) (Diff from Prior Year) Taxes 17,635,000 2,333,750 2,252,601 (81) 97% 2,374,687 (122,086) Licenses & Permits 1,440,000 253,750 1,899,680 1,646 749% 397,412 1,502,268 Intergovernmental Revenues
(3,000) Other Charges for Services 408,000 15,250 33,020 18 217% 24,336 8,683 Fines & Forfeitures 1,500,000 352,500 342,774 (10) 97% 356,160 (13,386) Investment Income 20,000 5,000 969 (4) 19% 1,746 (778) Contributions & Donations from Private Sources 5,000 250 250
600 (350) Miscellaneous Revenue 213,000 53,250 57,256 4 108% 40,726 16,530 Other Financing Sources 1,150,000 250,000 200,000 (50) 80%
Use of Prior Year Reserves 1,070,099 1,070,099 1,220,099 150 114%
Total Revenues & Resources 23,441,099 4,333,849 6,006,649 1,673 139% 3,198,668 2,807,981
Expenditures
Total Annual Budget YTD Budget YTD Actual Prior YTD Actual Flux ($ '000) (% of YTD Budget) (Diff from Prior Year) City Council 237,316 70,629 57,117 14 81% 53,951 (3,166) City Manager 367,566 91,212 58,573 33 64% 81,406 22,833 City Clerk 240,778 67,080 49,473 18 74% 48,285 (1,187) Legal 385,000 141,250 97,120 44 69% 133,762 36,642 Finance and Administration 2,939,336 761,492 687,551 74 90% 654,954 (32,596) Information Technology 858,073 223,518 196,875 27 88% 208,560 11,685 Marketing 490,294 122,574 101,653 21 83% 119,125 17,473 Municipal Court 604,022 150,016 97,604 52 65% 87,958 (9,646) Police 7,398,866 1,973,751 1,768,204 206 90% 1,486,195 (282,009) E-911 73,300 18,325 50,406 (32) 275% 17,417 (32,989) Public Works 3,281,439 819,665 635,143 185 77% 1,611,993 976,850 Parks & Recreation 1,612,167 405,017 385,451 20 95% 586,587 201,135 Community Development 2,657,144 664,286 1,664,426 (1,000) 251% 611,860 (1,052,566) Economic Development 1,448,968 362,242 349,125 13 96% 67,467 (281,657) Contingency 400,000 100,000 - 100 0%
Total Expenditures 22,994,269 5,971,056 6,198,721 (228) 104% 5,769,521 (429,200) Total Revenues over/(under) Expenditures 446,830 (1,637,207) (192,072) 1,445,135 (2,570,854) 2,378,782 YTD Variance Variance
4 6 8 YTD Actual Prior YTD Actual $ Millions
Revenues Summary
Use of Prior Year Reserves Other Financing Sources Miscellaneous Revenue Contributions & Donations from Private Sources Investment Income Fines & Forfeitures Other Charges for Services Intergovernmental Revenues Licenses & Permits Taxes
City Council , 1% City Manager , 1% City Clerk , 1% Legal , 1% Finance and Administration , 11% Information Technology , 3% Marketing , 2% Municipal Court , 2% Police , 28% E-911 , 1% Public Works , 10% Parks & Recreation , 6% Community Development , 27% Economic Development , 6% Contingency , 0% Other, 24%
Expenditure Summary
YTD Actual
SLIDE 2 City of Dunwoody
YTD Statement of Revenues and Expenses Through March 31, 2015
Revenues
Total Annual Budget YTD Budget YTD Actual Prior YTD Actual Flux ($ '000) (% of YTD Budget) (Diff from Prior Year) Real Property Tax 5,700,000
36,814 (36,814) Personal Property Tax 400,000
13,139 (13,139) Motor Vehicle 560,000 140,000 155,686 16 111% 128,947 (26,739) Intangibles (Reg & Recording) 60,000 15,000 23,547 9 157% 33,392 (9,845) Franchise Fees 3,500,000 230,000 152,523 (77) 66% 325,129 (172,605) Hotel/Motel Tax 1,380,000 345,000 402,461 57 117% 363,201 39,260 Alcoholic Beverage Excise Tax 650,000 162,500 138,933 (24) 85% 156,819 (17,886) MVR Excise Tax 100,000 25,000 26,330 1 105% 24,324 2,006 Excise Tax on Energy
13,353 (10,444) Business & Occupation Tax 2,750,000 1,300,000 1,247,288 (53) 96% 1,167,403 79,885 Insurance Premium Tax 2,400,000
Financial Institutions Tax 110,000 110,000 102,904 (7) 94% 107,732 (4,827) Penalties & int on delinq taxe 5,000 1,250 - (1) 0% 2,347 (2,347) Pen & Int on delinq taxes-Business 20,000 5,000 21 (5) 0% 2,088 (2,067) Taxes 17,635,000 2,333,750 2,252,601 (81) 97% 2,374,687 (122,086) Alcoholic Beverage Licenses 425,000
20,507 76 Other Licenses and Permits
350 1,960 Planning & Zoning Fees 15,000 3,750 2,720 (1) 73% 10,870 (8,150) Bldg Structures & Equipment 1,000,000 250,000 1,858,192 1,608 743% 351,835 1,506,358 Soil Erosion
Plan Review-Fire
13,850 (1,900) Licenses & Permits 1,440,000 253,750 1,899,680 1,646 749% 397,412 1,502,268 Local Government Grants
3,000 (3,000) Intergovernmental Revenues
3,000 (3,000) Election Qualifying Fees
Sale of maps and publications
80 (80) Special Police Services 10,000 2,499 3,770 1 151% 2,730 1,040 Fingerprinting Fee 5,000 1,251 1,873 1 150% 1,620 253 Public Safety-Other 36,000 9,000 22,277 13 248% 13,748 8,528 Special Assessments 20,000 - - - 38 (38) Streetlight Fees 327,000
5,431 (5,431) Recreation Program Fees
159 (159) Pavilion Rentals 10,000 2,500 5,100 3 204% 500 4,600 NSF Fees
30 (30) Other Charges for Services 408,000 15,250 33,020 18 217% 24,336 8,683 Municipal Court Fines & Forfeitures 1,500,000 352,500 342,774 (10) 97% 356,160 (13,386) Cash Confiscation
Fines & Forfeitures 1,500,000 352,500 342,774 (10) 97% 356,160 (13,386) Interest Revenue 20,000 5,000 969 (4) 19% 1,746 (778) Investment Income 20,000 5,000 969 (4) 19% 1,746 (778) Contr & Don From Priv Sources
Explorer Donations 5,000 250 250
Donations
Contributions & Donations from Private Sources 5,000 250 250 - 100% 600 (350) Rents & Royalties 198,000 49,500 56,999 7 115% 28,116 (28,883) Reimb for damaged property
11,830 (11,830) Other Charges For Services 15,000 3,750 252 (3) 7% 30 222 Miscellaneous Revenue
750 (745) Miscellaneous Revenue 213,000 53,250 57,256 4 108% 40,726 16,530 Proceeds from sale of property 1,150,000 250,000 200,000 (50) 80%
Other Financing Sources 1,150,000 250,000 200,000 (50) 80%
Use of Prior Year Reserves 1,070,099 1,070,099 1,220,099 150 114%
Total Revenues 23,441,099 4,333,849 6,006,649 1,673 139% 3,198,668 2,807,981 Variance
SLIDE 3 City of Dunwoody
YTD Statement of Revenues and Expenses Through March 31, 2015
City Council
Total Annual Budget YTD Budget YTD Actual Prior YTD Actual Flux ($ '000) (% of YTD Budget) (Diff from Prior Year) Personnel Services 142,966 35,742 34,910 1 98% 33,749 (1,161) Purchased/ Contracted Services 80,850 31,213 20,283 11 65% 16,006 (4,277) Supplies and Materials 13,500 3,675 1,925 2 52% 4,197 2,271 Total City Council 237,316 70,629 57,117 14 81% 53,951 (3,166)
City Council
Total Annual Budget YTD Budget YTD Actual Prior YTD Actual Flux ($ '000) (% of YTD Budget) (Diff from Prior Year) Regular Salaries 88,000 22,000 22,000 0 100% 22,066 66 Group Insurance 48,234 12,059 11,133 1 92% 10,114 (1,018) Social Security 5,456 1,364 1,265 0 93% 1,272 6 Medicare 1,276 319 296 0 93% 297 1 Workers' Compensation
Personnel Services 142,966 35,742 34,910 1 98% 33,749 (1,161) Professional Services 4,000 1,000 - 1 0% 168 168 Technical Services 3,500 875
0%
Property/Liability Insurance 40,000 20,000 16,005 4 80% 10,914 (5,091) Communications 6,500 1,625 316 1 19% 305 (11) Printing & Binding 3,900 975
0%
Travel 11,000 2,750 740 2 27% 791 51 Dues & Fees 4,000 1,000 232 1 23% 1,124 892 Education & Training 7,950 2,988 2,990 (0) 100% 2,705 (285) Purchased/ Contracted Services 80,850 31,213 20,283 11 65% 16,006 (4,277) Supplies 4,000 1,000 348 1 35% 722 374 Food 4,800 1,500 1,577 (0) 105% 1,683 106 Books & Periodicals 700 175
0% 188 188 Small Equipment 4,000 1,000 - 1 0% 1,604 1,604 Supplies and Materials 13,500 3,675 1,925 2 52% 4,197 2,271 Total City Council 237,316 70,629 57,117 14 81% 53,951 (3,166) Variance Variance
20 30 40 50 60 YTD Actual Prior YTD Actual $ Thousands Supplies and Materials Purchased/ Contracted Services Personnel Services Personnel Services 54% Purchased/ Contracted Services 42% Supplies and Materials 4% YTD Actual
SLIDE 4 City of Dunwoody
YTD Statement of Revenues and Expenses Through March 31, 2015
City Council
Davis Shortal Nall Riticher Deutsch Thompson Heneghan Unallocated Total Regular Salaries 4,000 3,000 3,000 3,000 3,000 3,000 3,000 22,000 Group Insurance 1,797 4,615 4,721 11,133 Social Security 248 186 154 186 174 131 186 1,265 Medicare 58 44 36 44 41 31 44 296 Workers' Compensation 31 31 31 31 31 31 31 216 Personnel Services 6,134 3,260 7,837 3,260 3,245 7,913 3,260
Professional Services
- Technical Services
- Property/Liability Insurance
16,005 16,005 Communications 114 183 19 316 Travel 44 696 740 Dues & Fees 227 5 232 Education & Training 615 740 1,020 615 2,990 Purchased/ Contracted Services 385 615 745 1,020 615
16,720 20,283 Supplies 80 25 16 12 120 12 16 66 348 Food 261 1,316 1,577 Books & Periodicals
- Small Equipment
- Supplies and Materials
341 25 16 12 120 12 16 1,382 1,925 Total City Council 6,860 3,901 8,598 4,293 3,981 7,925 3,459 18,102 57,117 Please see the subsequent page for a breakdown of all non-payroll expenses; including those charged to each Councilmember's discretionary allowance. Section 2.07 of the Dunwoody Code of Ordinances states, "The mayor shall be provided an annual expense allowance of $5,000.00 and each councilmember shall be provided an annual expense allowance of $3,000.00 for the reimbursement of expenses actually and necessarily incurred by the mayor and councilmembers in carrying out their duties as elected officials of the city."
SLIDE 5 Project Council Member Date Vendor Description Account Non‐ Allowance Charter Allowance Total DS Denny Shortal 01/31/2015 Dillard's 364 Southpar Ipad Stand Supplies 25.38 03/31/2015 Georgia Municipal Ecom GMA Conference Training 615.00 640.38
DT Doug Thompson 01/31/2015 Dillard's 230 St Johns Ipad Stand Supplies 12.28 12.28
JH John Heneghan 01/13/2015 Verizon Wireless Wireless voice and/or Data Communications 60.94 01/31/2015 Dillard's 167 Westgate Ipad Stand Supplies 15.90 02/28/2015 Verizon Wireless Wireless voice and/or Data Communications 60.94 03/13/2015 Verizon Wireless Wireless voice and/or Data Communications 60.69 15.90 182.57 198.47 JR Jim Riticher 01/31/2015 Dillard's 230 St Johns Ipad Stand Supplies 12.28 01/31/2015 Georgia Municipal GMA Mayor's Day Conference Training 405.00 03/31/2015 Georgia Municipal Ecom GMA Conference Training 615.00 1,032.28 - 1,032.28 LD Lynn Deutsch 01/31/2015 Dillard's 301 St Louis Ipad Stand Supplies 20.30 01/31/2015 CDW Government New Laptop Battery Supplies 99.84 03/31/2015 Georgia Municipal Ecom GMA Conference Training 615.00 735.14
TN Terry Nall 01/05/2015 Dunwoody Chamber of Commerce Dues, Registrations & Subscriptions Dues 5.00 01/31/2015 Dillard's 167 Westgate Ipad Stand Supplies 15.90 03/31/2015 Georgia Municipal Ecom GMA Conference Training 740.00 755.90 5.00 760.90 MD Michael Davis 01/13/2015 Verizon Wireless Wireless voice and/or Data Communications 38.01 01/31/2015 Council for Quality Growth Dues, Registrations & Subscriptions Dues 50.00 01/31/2015 DJ Wall St Journal Dues, Registrations & Subscriptions Dues 28.99 01/31/2015 Metro Awards Name Badge Supplies 60.00 01/31/2015 Dillard's 301 St Louis Ipad Stand Supplies 20.30 01/31/2015 J Alexanders Lunch-RE: Dunwoody/DeKalb Co Relations - Mayor, City Manager, Police Chief, and DeKalb Police Chief Food 150.15 01/31/2015 Marlow's Tavern Lunch with City Manager Food 22.41 02/28/2015 Verizon Wireless Wireless voice and/or Data Communications 38.01 02/28/2015 Lanier Parking #10173 Parking - Attendance at DeKalb Chamber 77th Annual Meeting Travel 10.00 02/28/2015 Lanier Parking #10621 Parking - Attendance at Georgia Trend Luncheon Travel 16.00 02/28/2015 LAZ Parking Parking - Attendance at Atlanta Chamber Mercedes Location Announcement Travel 12.00 02/28/2015 DJ Wall St Journal Dues, Registrations & Subscriptions Dues 28.99 02/28/2015 California Pizza Lunch with Lisa Vickory - Re: Lemonade Days Food 33.16 03/11/2015 Dunwoody Chamber of Commerce Dues, Registrations & Subscriptions Dues 25.00 03/13/2015 Verizon Wireless Wireless voice and/or Data Communications 38.01 03/31/2015 Goldfish Lunch with Michael Starling - Re: Economic Development Food 55.01 03/31/2015 Lanier Parking #10368 Parking - Attendance at Irish Counsel General's Breakfast Travel 6.00 03/31/2015 DJ Wall St Journal Dues, Registrations & Subscriptions Dues 28.99 03/31/2015 Council for Quality Growth Dues, Registrations & Subscriptions Dues 65.00 80.30 645.73 726.03 Council & Mayor General 01/01/2015 GIRMA Liability Insurance Insurance 16,004.67 01/13/2015 Purchase Power Postage Communications 11.94 02/28/2015 Purchase Power Postage Communications 7.41 02/28/2015 American Coach Lines Annual Retreat Bus Rental Travel 696.00 02/28/2015 Embassy Suites Anunal Retreat Tour of Cities Food Food 1,128.38 02/28/2015 Ippoliots Anunal Retreat Tour of Cities Food Food 165.29 03/31/2015 Metro Awards Name Badges Supplies 66.00 03/31/2015 Chick-Fil-A Dinner for Comprehensive Plan Workshop night meeting Food 22.69 18,102.38
22,207.85 Section 2.07 of the Dunwoody Code of Ordinances states, "The mayor shall be provided an annual expense allowance of $5,000.00 and each councilmember shall be provided an annual expense allowance of $3,000.00 for the reimbursement of expenses actually and necessarily incurred by the mayor and councilmembers in carrying out their duties as elected officials of the city." The expenses highlighted below are those credited to that allowance and totaled separately. Expenses not highlighted are other expenses attributable to the City Council Department budget.
SLIDE 6 City of Dunwoody
YTD Statement of Revenues and Expenses Through March 31, 2015
City Manager
Total Annual Budget YTD Budget YTD Actual Prior YTD Actual Flux ($ '000) (% of YTD Budget) (Diff from Prior Year) Personnel Services 344,886 85,042 54,696 30 64% 77,586 22,890 Purchased/ Contracted Services 18,710 4,678 2,366 2 51% 2,213 (153) Supplies and Materials 3,970 1,493 1,511 (0) 101% 1,608 96 Total City Manager 367,566 91,212 58,573 33 64% 81,406 22,833
City Manager
Total Annual Budget YTD Budget YTD Actual Prior YTD Actual Flux ($ '000) (% of YTD Budget) (Diff from Prior Year) Regular Salaries 257,479 62,536 43,331 19 69% 60,599 17,269 Group Insurance 41,971 10,493 3,383 7 32% 6,879 3,495 Medicare 3,661 915 525 0 57% 797 271 Retirement 40,902 10,226 6,802 3 67% 9,053 2,252 Workers' Compensation 873 873 655 0 75% 258 (397) Personnel Services 344,886 85,042 54,696 30 64% 77,586 22,890 Technical Services
Repairs & Maintenance
Communications 3,110 778 413 0 53% 673 260 Printing & Binding 625 156 768 (1) 491% 427 (341) Travel 7,000 1,750 14 2 1% 14 - Dues & Fees 2,875 719
0% 200 200 Education & Training 5,100 1,275 575 1 45% 899 324 Purchased/ Contracted Services 18,710 4,678 2,366 2 51% 2,213 (153) Supplies 1,700 925 1,320 (0) 143% 832 (488) Food 1,500 375 191 0 51% 431 240 Books & Periodicals 320 80
0% 30 30 Small Equipment 450 113
0% 314 314 Supplies and Materials 3,970 1,493 1,511 (0) 101% 1,608 96 Total City Manager 367,566 91,212 58,573 33 64% 81,406 22,833 Variance Variance
Personnel Services 93% Purchased/ Contracted Services 4% Supplies and Materials 3% YTD Actual ‐ 20 40 60 80 100 YTD Actual Prior YTD Actual $ Thousands Supplies and Materials Purchased/ Contracted Services Personnel Services
SLIDE 7 City of Dunwoody
YTD Statement of Revenues and Expenses Through March 31, 2015
City Clerk
Total Annual Budget YTD Budget YTD Actual Prior YTD Actual Flux ($ '000) (% of YTD Budget) (Diff from Prior Year) Personnel Services 124,638 30,475 31,511 (1) 103% 29,709 (1,802) Purchased/ Contracted Services 96,640 31,730 16,277 15 51% 17,919 1,641 Supplies and Materials 19,500 4,875 1,684 3 35% 657 (1,026) Transfers Out
Total City Clerk 240,778 67,080 49,473 18 74% 48,285 (1,187)
City Clerk
Total Annual Budget YTD Budget YTD Actual Prior YTD Actual Flux ($ '000) (% of YTD Budget) (Diff from Prior Year) Salaries 92,791 22,397 23,517 (1) 105% 22,397 (1,120) Group Insurance 15,313 3,828 3,552 0 93% 3,373 (179) Medicare 1,346 337 304 0 90% 304 (0) Retirement 15,033 3,758 3,911 (0) 104% 3,456 (454) Workers' Compensation 155 155 228 (0) 147% 179 (49) Personnel Services 124,638 30,475 31,511 (1) 103% 29,709 (1,802) Professional Services 60,000 15,000 1,767 13 12%
Technical Services 800 200
0% 400 400 Repairs and Maintenance 23,800 13,520 12,501 1 92% 15,756 3,255 Communications 2,040 510 317 0 62% 279 (39) Advertising 2,000 500 457 0 91%
Printing & Binding 500 125 30 0 24%
Travel 3,750 938
0% 817 817 Dues & Fees 267 67
0% 67 67 Education & Training 3,483 871 1,205 (0) 138% 600 (605) Purchased/ Contracted Services 96,640 31,730 16,277 15 51% 17,919 1,641 Supplies 1,700 425 177 0 42% 657 481 Food 400 100 65 0 65%
Books & Periodicals 400 100
0%
Small Equipment 17,000 4,250 1,442 3 34%
Supplies and Materials 19,500 4,875 1,684 3 35% 657 (1,026) Total City Clerk 240,778 67,080 49,473 18 74% 48,285 (1,187) Variance Variance
Personnel Services 64% Purchased/ Contracted Services 33% Supplies and Materials 3% YTD Actual ‐ 10 20 30 40 50 YTD Actual Prior YTD Actual $ Thousands Supplies and Materials Purchased/ Contracted Services Personnel Services
SLIDE 8 City of Dunwoody
YTD Statement of Revenues and Expenses Through March 31, 2015
Legal
Total Annual Budget YTD Budget YTD Actual Prior YTD Actual Flux ($ '000) (% of YTD Budget) (Diff from Prior Year) Purchased/ Contracted Services 385,000 141,250 97,120 44 69% 133,445 36,325 Supplies and Materials
317 317 Total Legal 385,000 141,250 97,120 44 69% 133,762 36,642
Legal
Total Annual Budget YTD Budget YTD Actual Prior YTD Actual Flux ($ '000) (% of YTD Budget) (Diff from Prior Year) Professional Services 385,000 141,250 97,081 44 69% 133,432 36,351 Communications
Travel
13 13 Purchased/ Contracted Services 385,000 141,250 97,120 44 69% 133,445 36,325 Food
17 17 Supplies and Materials
317 317 Total Legal 385,000 141,250 97,120 44 69% 133,762 36,642 Variance Variance
Purchased/ Contracted Services 100% Supplies and Materials 0% YTD Actual ‐ 20 40 60 80 100 120 140 YTD Actual Prior YTD Actual $ Thousands Supplies and Materials Purchased/ Contracted Services
SLIDE 9 City of Dunwoody
YTD Statement of Revenues and Expenses Through March 31, 2015
Finance and Administration
Total Annual Budget YTD Budget YTD Actual Prior YTD Actual Flux ($ '000) (% of YTD Budget) (Diff from Prior Year) Personnel Services 235,721 57,940 52,053 6 90% 48,588 (3,465) Purchased/ Contracted Services 2,374,425 616,255 557,662 59 90% 528,193 (29,469) Supplies 79,190 24,798 15,335 9 62% 7,798 (7,537) Transfers Out 250,000 62,500 62,500
Total Finance and Administration 2,939,336 761,492 687,551 74 90% 654,954 (32,596)
Finance and Administration
Total Annual Budget YTD Budget YTD Actual Prior YTD Actual Flux ($ '000) (% of YTD Budget) (Diff from Prior Year) Regular Salaries 140,634 34,052 34,052
Group Insurance 22,609 5,652 5,137 1 91% 4,880 (257) Medicare 2,040 510 443 0 87% 425 (17) Retirement 22,783 5,696 5,893 (0) 103% 4,860 (1,033) Workers' Compensation 155 155 345 (0) 223% 179 (166) Other Employee Benefits 47,500 11,875 6,184 6 52% 5,501 (682) Personnel Services 235,721 57,940 52,053 6 90% 48,588 (3,465) Official/Admin Services 1,349,997 337,499 337,100 0 100% 312,499 (24,600) Professional Services 148,916 37,229 29,652 8 80% 23,830 (5,822) Technical Services 40,900 3,725 1,297 2 35% 5,805 4,508 Repairs & Maintenance 97,313 24,328 8,904 15 37% 1,900 (7,004) Rentals 523,419 130,855 105,243 26 80% 105,096 (147) Insurance 55,000 11,000 11,961 (1) 109% 16,084 4,123 Communications 9,160 2,290 2,831 (1) 124% 1,760 (1,071) Advertising 3,900 975
0%
Printing & Binding 8,400 2,100 1,029 1 49% 2,065 1,036 Travel 3,500 875 2,185 (1) 250%
Dues & Fees 63,920 47,878 47,559 0 99% 47,889 330 Education & Training 41,200 10,300 3,174 7 31% 4,150 976 Other Charges 28,800 7,200 6,727 0 93% 7,115 387 Purchased/ Contracted Services 2,374,425 616,255 557,662 59 90% 528,193 (29,469) Supplies 17,500 4,375 1,735 3 40% 2,995 1,260 Electricity 24,000 10,000 9,666 0 97% 1,864 (7,802) Diesel 10,000 2,500
0%
Food 22,290 5,573 1,453 4 26% 1,023 (430) Books & Periodicals 1,500 375
0%
Small Equipment 3,900 1,975 2,482 (1) 126% 1,917 - Supplies 79,190 24,798 15,335 9 62% 7,798 (7,537) Transfers to Capital 250,000 62,500 62,500
Transfers Out 250,000 62,500 62,500
70,375 7,875 Total Finance and Administration 2,939,336 761,492 687,551 74 90% 654,954 (32,596) Variance Variance
Personnel Services 8% Purchased/ Contracted Services 89% Supplies 3% YTD Actual ‐ 100 200 300 400 500 600 700 YTD Actual Prior YTD Actual $ Thousands Supplies Purchased/ Contracted Services Personnel Services
SLIDE 10 City of Dunwoody
YTD Statement of Revenues and Expenses Through March 31, 2015
Information Technology
Total Annual Budget YTD Budget YTD Actual Prior YTD Actual Flux ($ '000) (% of YTD Budget) (Diff from Prior Year) Purchased/ Contracted Services 696,988 176,247 146,362 30 83% 145,796 (566) Supplies 55,465 20,866 24,108 (3) 116% 17,920 (6,188) Transfers Out 105,620 26,405 26,405
Total Information Technology 858,073 223,518 196,875 27 88% 208,560 11,685
Information Technology
Total Annual Budget YTD Budget YTD Actual Prior YTD Actual Flux ($ '000) (% of YTD Budget) (Diff from Prior Year) Official/Admin Svcs 458,082 114,521 92,493 22 81% 73,554 (18,939) Professional Services
40 40 Technical Services 11,000 4,750 10,189 (5) 215% 2,053 (8,136) Repairs & Maintenance 165,847 41,462 26,759 15 65% 57,012 30,253 Communications 58,559 14,640 16,921 (2) 116% 13,137 (3,785) Printing & Binding 500 125
0%
Education & Training 3,000 750
0%
Purchased/ Contracted Services 696,988 176,247 146,362 30 83% 145,796 (566) Supplies 650 163 150 0 92% 312 162 Small Equipment 54,815 20,704 23,958 (3) 116% 17,609 - Supplies 55,465 20,866 24,108 (3) 116% 17,920 (6,188) Transfers to Capital 105,620 26,405 26,405
Transfers Out 105,620 26,405 26,405
44,844 18,439 Total Information Technology 858,073 223,518 196,875 27 88% 208,560 11,685 Variance Variance
Purchased/ Contracted Services 86% Supplies 14% YTD Actual 130 135 140 145 150 155 160 165 170 175 YTD Actual Prior YTD Actual $ Thousands Supplies Purchased/ Contracted Services
SLIDE 11 City of Dunwoody
YTD Statement of Revenues and Expenses Through March 31, 2015
Marketing
Total Annual Budget YTD Budget YTD Actual Prior YTD Actual Flux ($ '000) (% of YTD Budget) (Diff from Prior Year) Purchased/ Contracted Services 472,494 118,124 100,510 18 85% 117,030 16,521 Supplies 17,800 4,450 1,143 3 26% 2,095 952 Total Marketing 490,294 122,574 101,653 21 83% 119,125 17,473
Marketing
Total Annual Budget YTD Budget YTD Actual Prior YTD Actual Flux ($ '000) (% of YTD Budget) (Diff from Prior Year) Official/Admin Services 307,954 76,989 76,988 0 100% 74,746 (2,243) Professional Services 60,040 15,010 7,705 7 51% 15,241 7,536 Technical Services 14,000 3,500 2,340 1 67% 2,686 346 Communications 7,500 1,875 88 2 5% 69 (19) Advertising 55,000 13,750 11,626 2 85% 11,194 (431) Printing & Binding 25,000 6,250 33 6 1% 9,969 9,936 Dues & Fees 3,000 750 1,729 (1) 231% 3,125 1,396 Purchased/ Contracted Services 472,494 118,124 100,510 18 85% 117,030 16,521 Supplies 10,000 2,500 1,002 1 40% 1,213 211 Food 7,000 1,750 141 2 8% 93 (48) Books & Periodicals 800 200
0%
Small Equipment
789 - Supplies 17,800 4,450 1,143 3 26% 2,095 952 Total Marketing 490,294 122,574 101,653 21 83% 119,125 17,473 Variance Variance
Purchased/ Contracted Services 99% Supplies 1% YTD Actual 90 95 100 105 110 115 120 YTD Actual Prior YTD Actual $ Thousands Supplies Purchased/ Contracted Services
SLIDE 12 City of Dunwoody
YTD Statement of Revenues and Expenses Through March 31, 2015
Municipal Court
Total Annual Budget YTD Budget YTD Actual Prior YTD Actual Flux ($ '000) (% of YTD Budget) (Diff from Prior Year) Personnel Services 292,092 72,033 59,054 13 82% 49,757 (9,297) Purchased/ Contracted Services 297,850 74,463 37,493 37 50% 33,667 (3,825) Supplies and Materials 14,080 3,520 1,058 2 30% 4,534 3,477 Other Financing Uses
Total Municipal Court 604,022 150,016 97,604 52 65% 87,958 (9,646)
Municipal Court
Total Annual Budget YTD Budget YTD Actual Prior YTD Actual Flux ($ '000) (% of YTD Budget) (Diff from Prior Year) Regular Salaries 189,442 45,906 41,467 4 90% 35,127 (6,340) Overtime Salaries 22,909 5,727 119 6 2% 1,403 1,283 Group Insurance 45,684 11,421 7,943 3 70% 6,760 (1,183) Medicare 2,747 687 588 0 86% 504 (84) Retirement 30,690 7,673 8,472 (1) 110% 5,426 (3,046) Workers' Compensation 620 620 465 0 75% 537 72 Personnel Services 292,092 72,033 59,054 13 82% 49,757 (9,297) Professional Services 220,230 55,058 23,963 31 44% 25,704 1,742 Technical Services 36,735 9,184 4,396 5 48% 5,384 988 Repairs & Maintenance 17,390 4,348 2,044 2 47% 600 (1,444) Rentals 4,000 1,000 141 1 14% 173 33 Communications 7,710 1,928 859 1 45% 483 (376) Printing & Binding 1,100 275 48 0 17% 546 498 Travel 5,000 1,250 398 1 32% 277 (121) Dues & Fees 685 171 450 (0) 263% 50 (400) Education & Training 5,000 1,250 5,195 (4) 416% 450 (4,745) Purchased/ Contracted Services 297,850 74,463 37,493 37 50% 33,667 (3,825) Supplies 5,250 1,313 968 0 74% 981 13 Food 2,300 575 280 0 49% 248 (32) Books & Periodicals 600 150 (190)
Small Equipment 5,930 1,483
0% 3,306 3,306 Supplies and Materials 14,080 3,520 1,058 2 30% 4,534 3,477 Total Municipal Court 604,022 150,016 97,604 52 65% 87,958 (9,646) Variance Variance
Personnel Services 61% Purchased/ Contracted Services 38% Supplies and Materials 1% YTD Actual ‐ 20 40 60 80 100 YTD Actual Prior YTD Actual $ Thousands Supplies and Materials Purchased/ Contracted Services Personnel Services
SLIDE 13 City of Dunwoody
YTD Statement of Revenues and Expenses Through March 31, 2015
Police
Total Annual Budget YTD Budget YTD Actual Prior YTD Actual Flux ($ '000) (% of YTD Budget) (Diff from Prior Year) Personnel Services 5,674,887 1,475,394 1,318,086 157 89% 1,170,726 (147,360) Purchased/ Contracted Services 617,388 169,120 137,823 31 81% 161,052 23,229 Supplies and Materials 502,091 178,113 161,170 17 90% 133,317 (27,854) Other Financing Uses 604,500 151,125 151,125
Total Police 7,398,866 1,973,751 1,768,204 206 90% 1,486,195 (282,009)
Police
Total Annual Budget YTD Budget YTD Actual Prior YTD Actual Flux ($ '000) (% of YTD Budget) (Diff from Prior Year) Regular Salaries 3,596,581 881,012 818,231 63 93% 732,255 (85,976) Overtime Salaries 352,040 88,010 13,587 74 15% 25,335 11,748 Total Salaries 3,948,621 969,022 831,819 137 86% 757,590 (74,228) Group Insurance 868,242 217,061 206,612 10 95% 172,087 (34,525) Medicare 57,256 14,314 11,023 3 77% 10,185 (838) Retirement 599,990 149,998 143,645 6 96% 109,872 (33,773) Workers' Compensation 200,778 125,000 124,987 0 100% 120,992 (3,995) Personnel Services 1,726,266 506,372 486,267 20 96% 413,136 (73,131) Professional Services 17,000 4,250 6,557 (2) 154% 7,038 481 Technical Services 23,840 5,960 1,690 4 28% 7,866 6,176 Repairs & Maintenance 293,495 73,374 47,498 26 65% 87,211 39,713 Rentals 15,700 3,925 4,348 (0) 111% 2,407 (1,940) Insurance 100,909 30,000 28,382 2 95% 21,828 (6,555) Claims
2,000 217 Communications 61,800 25,450 24,411 1 96% 16,328 (8,084) Advertising 2,500 625
0%
Printing & Binding 6,160 1,540 1,288 0 84% 1,009 (279) Travel 39,000 9,750 5,944 4 61% 5,270 (674) Dues & Fees 18,799 4,700 4,320 0 92% 1,121 (3,199) Education & Training 38,185 9,546 11,603 (2) 122% 8,975 (2,628) Purchased/ Contracted Services 617,388 169,120 137,823 31 81% 161,052 23,229 Supplies 102,950 25,738 28,935 (3) 112% 19,394 (9,541) Supplies-Explorer Program 6,000 1,500 2,380 (1) 159% 242 (2,138) Gasoline 275,000 68,750 34,477 34 50% 53,140 18,664 Food 6,000 1,500 219 1 15% 573 355 Books & Periodicals 2,500 625 388 0 62% 1,144 756 Small Equipment 109,641 80,000 94,771 (15) 118% 58,823 (35,948) Supplies and Materials 502,091 178,113 161,170 17 90% 133,317 (27,854) Transfers to Capital Fund 604,500 151,125 151,125
Other Financing Uses 604,500 151,125 151,125
21,100 (130,026) Total Police 7,398,866 1,973,751 1,768,204 206 90% 1,486,195 (282,009) Variance Variance
Personnel Services 74% Purchased/ Contracted Services 8% Supplies and Materials 9% Other Financing Uses 9% YTD Actual ‐ 200 400 600 800 1,000 1,200 1,400 1,600 1,800 YTD Actual Prior YTD Actual $ Thousands Other Financing Uses Supplies and Materials Purchased/ Contracted Services Personnel Services
SLIDE 14
City of Dunwoody
YTD Statement of Revenues and Expenses Through March 31, 2015
E-911
Total Annual Budget YTD Budget YTD Actual Prior YTD Actual Flux ($ '000) (% of YTD Budget) (Diff from Prior Year) Transfers to E-911 Fund 73,300 18,325 50,406 (32) 275% 17,417 (32,989) Total E-911 73,300 18,325 50,406 (32) 275% 17,417 (32,989) Variance
SLIDE 15 City of Dunwoody
YTD Statement of Revenues and Expenses Through March 31, 2015
Public Works
Total Annual Budget YTD Budget YTD Actual Prior YTD Actual Flux ($ '000) (% of YTD Budget) (Diff from Prior Year) Personnel Services 160,034 39,313 40,955 (2) 104% 36,940 (4,016) Purchased/ Contracted Services 1,429,955 357,489 176,011 181 49% 436,327 260,317 Supplies and Materials 546,450 136,613 131,927 5 97% 117,476 (14,451) Transfers to Capital Fund 1,145,000 286,250 286,250
Total Public Works 3,281,439 819,665 635,143 185 77% 1,611,993 976,850
Public Works
Total Annual Budget YTD Budget YTD Actual Prior YTD Actual Flux ($ '000) (% of YTD Budget) (Diff from Prior Year) Salaries 117,371 28,531 28,531 0 100% 27,500 (1,031) Group Insurance 21,792 5,448 5,060 0 93% 4,806 (254) Medicare 1,702 426 379 0 89% 363 (15) Retirement 19,014 4,754 4,966 (0) 104% 4,092 (874) Workers' Compensation 155 155 2,020 (2) 1303% 179 (1,841) Personnel Services 160,034 39,313 40,955 (2) 104% 36,940 (4,016) Official/Admin Svcs 225,000 56,250 56,249 0 100% 63,750 7,501 Professional Services 120,000 30,000 130 30 0% 55,033 54,902 Tree Fund Expenses 93,000 23,250 3,150 20 14% 71,115 67,965 Professional Services
Technical Services 2,400 600
0% 600 600 Repairs & Maintenance 23,300 5,825
0%
R&M - Storm Damage Removal 40,000 10,000
0% 67,228 67,228 R&M - Street Maintenance 671,000 167,750 99,707 68 59% 114,907 15,200 R&M - Traffic Signals 196,000 49,000 8,601 40 18% 54,236 45,635 R&M - Right of Way Maint 45,000 11,250 6,196 5 55% 7,975 1,779 Claims 1,000 250 171 0 0%
Communications 1,700 425 1,010 (1) 238% 296 (714) Advertising 2,500 625
0% 801 801 Printing & Binding 1,500 375 750 (0) 200%
Travel 4,280 1,070 47 1 4% 386 339 Purchased/ Contracted Services 1,429,955 357,489 176,011 181 49% 436,327 260,317 Supplies-Office 1,200 300 2,656 (2) 885% 118 (2,538) Supplies-Road Materials 60,000 15,000 13,386 2 89% 6,337 (7,048) Electricity 485,000 121,250 114,213 7 94% 111,021 (3,193) Small Equipment
Supplies and Materials 546,450 136,613 131,927 5 97% 117,476 (14,451) Transfers to Capital Fund 1,145,000 286,250 286,250
Transfers to Capital Fund 1,145,000 286,250 286,250
1,021,250 735,000 Total Public Works 3,281,439 819,665 635,143 185 77% 1,611,993 976,850 Variance Variance
‐ 200 400 600 800 1,000 1,200 1,400 1,600 1,800 YTD Actual Prior YTD Actual $ Thousands Transfers to Capital Fund Supplies and Materials Purchased/ Contracted Services Personnel Services Personnel Services 12% Purchased/ Contracted Services 50% Supplies and Materials 38% YTD Actual
SLIDE 16 City of Dunwoody
YTD Statement of Revenues and Expenses Through March 31, 2015
Parks and Recreation
Total Annual Budget YTD Budget YTD Actual Prior YTD Actual Flux ($ '000) (% of YTD Budget) (Diff from Prior Year) Purchased/ Contracted Services 908,800 229,175 229,542 (0) 100% 139,393 (90,149) Supplies and Materials 270,000 67,500 47,567 20 70% 63,852 16,285 Transfers Out 433,367 108,342 108,342 0 100% 383,342 275,000 Total Parks and Recreation 1,612,167 405,017 385,451 20 95% 586,587 201,135
Parks and Recreation
Total Annual Budget YTD Budget YTD Actual Prior YTD Actual Flux ($ '000) (% of YTD Budget) (Diff from Prior Year) Official/Admin Svcs 202,800 50,700 50,700
Professional Services 10,000 4,500 9,249 (5) 206% 1,510 (7,738) R&M-Parks 660,000 165,000 161,615 3 98% 98,017 (63,598) Rentals 2,000 500
0%
Property/Liability Insurance 32,100 8,000 7,700 0 96% 8,616 917 Communications 1,500 375 279 0 74% 279 - Dues & Fees 400 100
0% 50 50 Purchased/ Contracted Services 908,800 229,175 229,542 (0) 100% 139,393 (90,149) Supplies 102,000 25,500 18,126 7 71% 18,766 639 Utilities 168,000 42,000 29,440 13 70% 45,086 15,646 Supplies and Materials 270,000 67,500 47,567 20 70% 63,852 16,285 Transfers to Debt Service Fund 108,367 27,092 27,092 0 100% 27,092 (0) Transfers to Capital Fund 325,000 81,250 81,250
Transfers Out 433,367 108,342 108,342 0 100% 383,342 275,000 Total Parks and Recreation 1,612,167 405,017 385,451 20 95% 586,587 201,135 Variance Variance
Purchased/ Contracted Services 60% Supplies and Materials 12% Transfers Out 28% YTD Actual ‐ 100 200 300 400 500 600 YTD Actual Prior YTD Actual $ Thousands Transfers Out Supplies and Materials Purchased/ Contracted Services
SLIDE 17 City of Dunwoody
YTD Statement of Revenues and Expenses Through March 31, 2015
Community Development
Total Annual Budget YTD Budget YTD Actual Prior YTD Actual Flux ($ '000) (% of YTD Budget) (Diff from Prior Year) Purchased/ Contracted Services 2,641,344 660,336 1,660,191 (1,000) 251% 605,270 (1,054,920) Supplies and Materials 15,800 3,950 4,235 (0) 107% 3,339 (896) Transfers Out
3,250 3,250 Total Community Development 2,657,144 664,286 1,664,426 (1,000) 251% 611,860 (1,052,566)
Community Development
Total Annual Budget YTD Budget YTD Actual Prior YTD Actual Flux ($ '000) (% of YTD Budget) (Diff from Prior Year) Official/Admin Svcs 1,937,000 484,250 1,622,178 (1,138) 335% 569,384 (1,052,793) Professional Services 447,945 111,986 24,430 88 22% 11,072 (13,358) Technical Services 124,602 31,151 2,950 28 9% 15,347 12,397 Repairs & Maintenance 101,397 25,349 5,144 20 20% 1,080 (4,064) Rentals
Communications 4,500 1,125 769 0 68% 2,306 1,537 Advertising 15,000 3,750 2,662 1 71% 3,567 904 Printing & Binding 5,000 1,250 427 1 34%
Travel 1,000 250 12 0 5% 250 238 Dues & Fees 1,900 475 250 0 53% 2,165 1,915 Education & Training 3,000 750
0%
Purchased/ Contracted Services 2,641,344 660,336 1,660,191 (1,000) 251% 605,270 (1,054,920) Supplies 11,500 2,875 1,125 2 39% 3,280 2,155 Food 1,000 250 736 (0) 294%
Books & Periodicals 1,000 250 180 0 72% 59 (121) Small Equipment 2,300 575 2,195 (2) 382%
Supplies and Materials 15,800 3,950 4,235 (0) 107% 3,339 (896) Transfers to Capital Fund
3,250 3,250 Transfers Out
3,250 3,250 Total Community Development 2,657,144 664,286 1,664,426 (1,000) 251% 611,860 (1,052,566) Variance Variance
Purchased/ Contracted Services 100% Supplies and Materials 0% YTD Actual ‐ 200 400 600 800 1,000 1,200 1,400 1,600 1,800 YTD Actual Prior YTD Actual $ Thousands Transfers Out Supplies and Materials Purchased/ Contracted Services
SLIDE 18 City of Dunwoody
YTD Statement of Revenues and Expenses Through March 31, 2015
Economic Development
Total Annual Budget YTD Budget YTD Actual Prior YTD Actual Flux ($ '000) (% of YTD Budget) (Diff from Prior Year) Purchased/ Contracted Services 91,468 22,867 9,660 13 42% 15,749 6,089 Supplies and Materials 1,500 375 465 (0) 124% 218 (246) Transfers Out 1,356,000 339,000 339,000
Total Economic Development 1,448,968 362,242 349,125 13 96% 67,467 (281,657)
Economic Development
Total Annual Budget YTD Budget YTD Actual Prior YTD Actual Flux ($ '000) (% of YTD Budget) (Diff from Prior Year) Professional Services 40,000 10,000 8,000 2 80% 10,000 2,000 Technical Services 7,800 1,950
0%
Communications 968 242
0%
Advertising 34,200 8,550 760 8 9% 4,050 3,290 Printing & Binding 3,500 875
0%
Travel 1,500 375
0% 4 4 Dues & Fees 3,500 875 900 (0) 103% 1,000 100 Education & Training
695 695 Purchased/ Contracted Services 91,468 22,867 9,660 13 42% 15,749 6,089 Supplies
218 218 Food 1,500 375 70 0 19%
Small Equipment
Supplies and Materials 1,500 375 465 (0) 124% 218 (246) Transfers to Debt Service Fund 1,356,000 339,000 339,000
Transfers Out 1,356,000 339,000 339,000
67,467 (281,657) Total Economic Development 1,448,968 362,242 349,125 13 96% 67,467 (281,657)
Contingency
Total Annual Budget YTD Budget YTD Actual Prior YTD Actual Flux ($ '000) (% of YTD Budget) (Diff from Prior Year) Contingency 400,000 100,000
0%
Total Contingency 400,000 100,000
0%
Total General Fund Expenditures 22,994,269 5,971,056 6,198,721 (228) 104% 5,769,521 (429,200) Total Revenues over/(under) Expenditures 446,830 (1,637,207) (201,072) 1,436 12% (2,570,854) 2,369,782 Variance Variance Variance
Purchased/ Contracted Services 3% Supplies and Materials 0% Transfers Out 97% YTD Actual ‐ 50 100 150 200 250 300 350 YTD Actual Prior YTD Actual $ Thousands Transfers Out Supplies and Materials Purchased/ Contracted Services
SLIDE 19 City of Dunwoody YTD Statement of Expenses Through March 31, 2015
Capital Projects Fund
Original Budget Adjustments/ Amendments Total Project Budget Spent in Prior Years Spent in Current Year Total Spent to Date Project Balance
Expenditures
Courtroom and Council AV 140,400 - 140,400 (127,191)
Emergency BackUp/Disaster Recovery System COMPLETE 2014 35,000 1,880 36,880 (34,290)
Off-site Replication of Servers for Disaster Recovery COMPLETE 2014 51,875 - 51,875 (47,251)
Unified Communications Upgrade to provide for Redundancy COMPLETED 2014 47,500 - 47,500 (47,159)
Website Redesign and Replacement 65,000 - 65,000 (55,854)
Data Center Power Protection 25,620 - 25,620 - - - 25,620 Physical Access and Video Control Management System 50,000 - 50,000 - - - 50,000 Unified Threat Management System 30,000 - 30,000 - - - 30,000 Information Technology 445,395 1,880 447,275 (311,746)
City Hall Design & Engineering Prefunding 100,000 - 100,000 - - - 100,000 Programming Study for Future City Hall 50,000 - 50,000 (1,200)
Facilities Improvement Partnership Program (2014 FIPP) 250,000 (29,275) 220,725 (75,376) (109,441) (184,817) 35,908 City Hall Reconfiguration for Efficiency 31,500 - 31,500 (17,084)
Facilities Improvement Partnership Program (2015 FIPP) 250,000 - 250,000 - - - 250,000 Facilities 681,500 (29,275) 652,225 (93,660) (109,441) (203,101) 449,124 Fixed LPR & Mobile LPR 119,875 - 119,875 (49,459)
Code Red 24,500 - 24,500 (18,875)
Vehicle Replacement 1,500,000 - 1,500,000 (483,284) (419,091) (902,375) 597,625 Daily Report Software 12,400 - 12,400 - - - 12,400 Surveillance System 113,000 180,375 293,375 (198,362)
New Position-Detective Machinery & Equipment 30,000 - 30,000 (26,057)
AFIS Automated Fingerprint Identification System 54,398 - 54,398 - - - 54,398 Lieutenant Capital 30,500 - 30,500 - (7,598) (7,598) 22,902 Major Capital (2) 61,000 - 61,000 - (15,197) (15,197) 45,803 Sergeant Promotional Assessment 13,000 - 13,000 - - - 13,000 Vehicle Replacement Fund 500,000 - 500,000 - - - 500,000 Police Department 2,458,673 180,375 2,639,048 (776,037) (441,886) (1,217,923) 1,421,125 Dunwoody Village TE Project 2,100,000 (525,103) 1,574,897 (1,127,854) (837) (1,128,691) 446,207 Road Resurfacing 10,631,000 83,697 10,714,697 (7,133,534) (785) (7,134,319) 3,580,379 New Sidewalks and ADA Ramps 2,970,000 45,000 3,015,000 (1,891,063) (2,805) (1,893,868) 1,121,132 Traffic Calming Radar Signs 100,000 - 100,000 (11,650)
- (11,650) 88,350
- N. Peachtree Rd/Tilly Mill Intersection Improvement
2,850,000 - 2,850,000 (420,330) (35,787) (456,117) 2,393,883
- Mt. Vernon Rd/Vermack Intersection Improvement
325,000 106,000 431,000 (97,451) (108) (97,559) 333,441 Womack/Vermack Intersection Improvement 200,000 - 200,000 (69,912)
Wayfinding 150,000 - 150,000 (79,516)
Chamblee Dunwoody & Spalding Drive 370,000 55,000 425,000 (102,535)
School Pedestrian Safety Improvements
- 40,000 40,000 (37,816)
- (37,816) 2,184
Concept Funding-Tilly Mill at Mt. Vernon Place 25,000 - 25,000 - - - 25,000 Concept Funding-Mt. Vernon at Tilly Mill 25,000 - 25,000 - - - 25,000 Concept Funding-Chamblee Dunwoody at Peeler 50,000 - 50,000 - - - 50,000 Intelligent Traffic System (ITS)-adding signals to network 85,000 - 85,000 - - - 85,000 Partial Construction Funding-Chamblee Dunwoody Rd from Cambridge to Valley View 800,000 - 800,000 (51,977) (41,033) (93,010) 706,990 Chesnut Elementary Pedestrian Project
- 40,000 40,000 (13,915)
- (13,915) 26,085
Kingsley Safe Routes to School-retaining walls
- 70,000 70,000 (43,439) (3,200) (46,639) 23,361
Construction Funding Mt. Vernon/Womack Pedestrian Crossing Improvements
- 150,000 150,000 - - - 150,000
Grant Match - TE grant - Chamblee Dunwoody
- 150,000 150,000 - - - 150,000
Winters Chapel (WalMart contribution)
- 30,000 30,000 - - - 30,000
D&E for Chamblee Dunwoody Georgetown Corridor 275,000 - 275,000 - - - 275,000 Construction funding for Chamblee Dunwoody Rd Bicycle & Pedestrian Improvements 850,000 - 850,000 - - - 850,000 Citywide Traffic Signal Communications 180,000 - 180,000 - - - 180,000 Public Works 21,986,000 244,595 22,230,595 (11,080,992) (84,555) (11,165,547) 11,065,047
1,025,000 2,225,000 3,250,000 (6,315) (1,116) (7,431) 3,242,569 Brook Run Demo 400,000 - 400,000 (217,767) (66,815) (284,582) 115,418 Brook Run Park Improvements 150,000 - 150,000 (111,114)
Brook Run Trail 572,010 841,777 1,413,787 (1,129,580) (11,105) (1,140,685) 273,101 Nancy Creek Greenway 25,000 - 25,000 (17,463)
Dunwoody Gateway Market Installation 150,000 - 150,000 (9,618)
Donaldson Chesnut Facility Stabilization 226,000 - 226,000 - - - 226,000 Design for Future Parks Trails Projects 25,000 - 25,000 - - - 25,000 Brook Run Dog Park Relocation 195,000 - 195,000 (35,268) (121,121) (156,389) 38,611 Dunwoody Park Parking Lot Resurfacing 100,000 - 100,000 - - - 100,000 Windwood Hollow Park Playground Replacement COMPLETED 2014 125,000 65,000 190,000 (190,000)
- (190,000)
- Emergency Notification System for Brook Run Park and Dunwoody Park
85,000 - 85,000 (72,012)
Georgetown Park-Shade Structure
- 75,000 75,000 - - - 75,000
Georgetown Park-Play Structure
- 25,000 25,000 - - - 25,000
Dunwoody Nature Center Parking Lot Resurfacing 100,000 - 100,000 - - - 100,000 Dunwoody Park Playground Replacement 225,000 - 225,000 - - - 225,000 Parks 3,403,010 3,231,777 6,634,787 (1,789,138) (200,156) (1,989,294) 4,645,493 GIS Webviewer COMPLETED 2014 75,000 - 75,000 (41,857)
Plotter Purchase 20,000 - 20,000 (6,096) (762) (6,858) 13,142 GIS Mobile Collection Unit COMPLETED 2014 13,000 - 13,000 (11,510)
Community Development 108,000 - 108,000 (59,463) (762) (60,225) 47,775 Completed/Abandoned Projects Closed Out
- 144,573 144,573 - - - 144,573
Unallocated
- 144,573 144,573
- - - 144,573
Total 29,082,578 3,773,924 32,856,502 (14,111,035) (836,801) (14,947,836) 17,908,665
SLIDE 20 City of Dunwoody YTD Statement of Revenues and Expenses Through March 31, 2015
E911 Fund
Total Annual Budget YTD Budget YTD Actual Prior YTD Actual Flux
($ '000) (% of YTD Budget) (Diff from Prior Year)
Revenues
E911 Revenue 1,200,000 300,000 241,889 (58) 81% 303,206 61,317 Transfers In 73,300 18,325 50,406 32 275% 17,417 (32,989) Total Revenues 1,273,300 318,325 292,295 (26) 92% 320,623 28,328
Expenditures
Communications 148,300 37,075 11,046 26 30% 79,623 68,578 Intergovernmental-E911 (Chatcomm) 1,125,000 281,250 281,250 - 100% 358,333 77,083 Total Expenditures 1,273,300 318,325 292,296 26 92% 437,956 145,661 Total Revenues over/(under) Expenditures
(0) (0) (117,333) (117,333) Variance
SLIDE 21 City of Dunwoody YTD Statement of Revenues and Expenses Through March 31, 2015
Hotel Excise Tax Fund
Total Annual Budget YTD Budget YTD Actual Prior YTD Actual Flux
($ '000) (% of YTD Budget) (Difference from Prior Year)
Revenues
Hotel/Motel Tax 2,300,000 575,000 670,768 96 117% 605,335 (65,433) Interest Revenue
3 0 Total Revenues 2,300,000 575,000 670,770 96 117% 605,338 (65,432)
Expenditures
Transfers to General Fund 1,380,000 345,000 402,461 (57) 117% 363,201 (39,260) Transfers to Component Unit - CVBD 920,000 230,000 268,307 (38) 117% 242,134 (26,173) Total Expenditures 2,300,000 575,000 670,768 (96) 117% 605,335 (65,433) Total Revenues over/(under) Expenditures
3 Variance
SLIDE 22 City of Dunwoody YTD Statement of Revenues and Expenses Through March 31, 2015
Motor Vehicle Rental Excise Tax Fund
Total Annual Budget YTD Budget YTD Actual Prior YTD Actual Flux
($ '000) (% of YTD Budget) (Difference from Prior Year)
Revenues
MV Rental Excise Tax 100,000 25,000 26,330 1 105% 24,324 (2,006) Total Revenues 100,000 25,000 26,330 1 105% 24,324 (2,006)
Expenditures
Transfers to General Fund 100,000 25,000 26,330 (1) 105% 24,324 (2,006) Total Expenditures 100,000 25,000 26,330 (1) 105% 24,324 (2,006) Total Revenues over/(under) Expenditures
SLIDE 23 City of Dunwoody YTD Statement of Revenues and Expenses Through March 31, 2015
HOST Fund
Total Annual Budget YTD Budget YTD Actual Prior YTD Actual Flux
($ '000) (% of YTD Budget) (Difference from Prior Year)
Revenues
Homestead Option Sales Tax 4,000,000 - - -
Interest Revenue 4,500 1,125 532 (1) 47%
Total Revenues 4,004,500 1,125 532 (1) 47% - 1,000,000
Expenditures
Transfers Out - Capital (PW) 4,000,000 1,000,000 1,000,000 - 100%
Total Expenditures 4,000,000 1,000,000 1,000,000 - 100% - (1,000,000) Total Revenues over/(under) Expenditures 4,500 (998,875) (999,468) (1) 100%
Variance
SLIDE 24 City of Dunwoody YTD Statement of Revenues and Expenses Through March 31, 2015
Debt Service Fund
Total Annual Budget YTD Budget YTD Actual Prior YTD Actual Flux
($ '000) (% of YTD Budget) (Difference from Prior Year)
Revenues
Transfers from General Fund 1,464,367 366,092 366,092 (0) 100% 78,592 (287,500) Total Revenues 1,464,367 366,092 366,092 (0) 100% 78,592 (287,500)
Expenditures
Lease Interest
58,019 58,019 Transfers Out - CU 1,464,088 78,522 78,522 0 100% 20,502 (58,019) Total Expenditures 1,464,088 78,522 78,522 0 100% 78,522 - Total Revenues over/(under) Expenditures 279 287,570 287,570 0 100% 70 (287,500) Variance
SLIDE 25 City of Dunwoody YTD Statement of Revenues and Expenses Through March 31, 2015
Stormwater fund
Total Annual Budget YTD Budget YTD Actual Prior YTD Actual Flux
($ '000) (% of YTD Budget) (Difference from Prior Year)
Revenues
Stormwater Utility Charges 1,851,622 - - - 2,708 2,708 Interest Revenue 800 200 202 0 101% 324 122 Residual Equity Transfer In 269,078 269,078 269,078 - 100%
Total Revenues 2,121,500 269,278 269,280 0 100% 3,032 (266,248)
Expenditures
Official/Admin Svcs 120,000 30,000 25,000 5 83% 30,000 5,000 Professional Services-Stormwater 160,000 40,000 14,201 26 36% 67 (14,134) Repairs & Maintenance 1,785,000 150,000 76,777 73 51% 264,533 187,756 Rep & Maint-Riprap Program 5,000 1,250 2,847 (2) 228%
Printing & Binding 500 125 - 0 0%
Dues & Fees 500 125 - 0 0%
Purchased/ Contracted Services 2,071,000 221,500 118,826 103 54% 294,600 175,775 Supplies 50,000 12,500 4,336 8 35% 5,699 1,364 Books & Periodicals 500 125 - 0 0%
Supplies and Materials 50,500 12,625 4,336 8 34% 5,699 1,364 Total Expenditures 2,121,500 234,125 123,161 111 53% 300,300 177,138 Total Revenues over/(under) Expenditures
416% (297,267) (443,387) Variance ‐ 50 100 150 200 250 300 350
YTD Actual Prior YTD Actual
$ Thousands
Supplies and Materials Purchased/ Contracted Services
Purchased/ Contracted Services 96% Supplies and Materials 4%
Expenditures
YTD Actual
SLIDE 26 Convention Vistors' Bureau of Dunwoody Monthly Statement of Revenues and Expenses March 31, 2015
Variance
CVB of Dunwoody
(% of YTD Budget) Fund Balance
Interest Revenue 1,152 288 127 44% 309 Other Revenue 8,442 2,111
1,033,449 258,362 268,307 104% 242,134 Residual Equity Transfer (Promotional Reserv 20,000 5,000 5,000 100%
1,043,043 260,761 268,435 103% 242,443
Expenditures
Employees/Personnel Salaries 288,757 58,173 60,409 104% 43,465 Benefits 35,554 8,160 6,391 78% 4,176 Payroll Taxes 28,876 5,817 4,573 79% 4,147 Unemployment
- Medic
- Total Employees/Personnel Expenditures
353,187 72,150 71,374 99% 51,788 Administrative Depreciation Expense
- Legal & Professional Fees
18,140 7,610 2,443 32% 2,250 Rent 44,047 10,683 23,647 221% 13,828 Employee Development 6,320 1,720 3,342 194% 2,665 Equipment Lease 1,920 465 449 97% 437 IT Support 6,960 1,740 1,963 113% 834 Insurance 3,900
1,262 Postage/Courier/Ovenight Mail
8,400 2,100 1,306 62% 1,633 Licenses & Fees 3,050 800
305 Miscellaneous 1,200 300 (56)
32 Office Expense 2,400 600 1,417 236% 325 Vehicle Expenses
3,600 900 540 60% 1,171 Travel 7,200 1,800 647 36% 404 Small Equipment 2,000
Furniture & Fixtures 10,000
- Total Administrative Expenditures
119,137 28,718 36,237 126% 29,258 Marketing Research 40,000 20,000 18,374 92%
30,800 7,700
9,000 Public Relations 12,000 3,000 4,500 150%
72,579 37,377 3,716 10% 7,952 Website Marketing 59,000 18,500 4,406 24% 10,500 Advertising - Print 96,000 24,000 23,650 99% 4,074 Advertising - Digital 78,000 19,500 15,168 78% 19,670 Printing 23,800 10,700 1,142 11% 3,737 Postage/Courier/Ovenight Mail 2,400 600
134 Dues & Subscriptions 9,483 327 2,992 915% 217 Memberships 12,259 10,559 1,790 17% 10,825 Customer Relationship Management Tool 13,500
9,000
450 Miscellaneous 1,800 450
- 0%
- Total Marketing Expenditures
460,621 152,713 77,522 51% 66,559 Promotional Community Development
Conventions and Trade Shows 20,569 5,980 6,746 113% 5,000 Event Hosting & Site Visits 24,500 1,750 2,100 120% (2,104) Sponsorships
1,000 Group Sales Show Sponsorships 33,500 5,500
- 0%
- Meals and Business Development
3,600 900 2,286 254% 622 Meeting Bids and Incentives 10,000 2,500
24,800 1,950 800 41% 7,829 Travel 13,200 3,300 5,104 155% 1,864 Promotional Materials 12,000 3,000 761 25% 2,249 Total Promotional Expenditures 142,169 24,880 26,797 108% 29,308 Total Expenditures 1,075,114 278,461 211,931 76% 176,914 Total Revenues over/(under) Expenditures (32,071) (17,700) 56,504 65,530 Prior YTD Actual Total Annual Budget YTD Budget YTD Actual
SLIDE 27
4/21/2015 10:29 AM A/P HISTORY CHECK REPORT PAGE: 1 VENDOR SET: 01 City of Dunwoody, GA BANK: * ALL BANKS DATE RANGE: 1/01/2015 THRU 3/31/2015 CHECK CHECK CHECK CHECK VENDOR I.D. NAME STATUS DATE AMOUNT DISCOUNT NO STATUS AMOUNT 001685 J.P. Morgan Chase Commercial C C-CHECK J.P. Morgan Chase CommerVOIDED V 2/06/2015 019071 126,302.95CR 001787 Optech RWM, LLC C-CHECK Optech RWM, LLC VOIDED V 2/20/2015 019136 32,244.40CR 1 SAU, THANH VOIDED C-CHECK SAU, THANH VOIDED V 2/06/2015 203060 1,080.00CR 1 NAZARIO-LIBORIO, LEONOR VOIDED C-CHECK NAZARIO-LIBORIO, LEONOR VOIDED V 2/06/2015 203067 350.00CR 1 HAMMER, KENNETH J VOIDED C-CHECK HAMMER, KENNETH J VOIDED V 2/20/2015 203094 350.00CR * * T O T A L S * * NO INVOICE AMOUNT DISCOUNTS CHECK AMOUNT REGULAR CHECKS: 0 0.00 0.00 0.00 HAND CHECKS: 0 0.00 0.00 0.00 DRAFTS: 0 0.00 0.00 0.00 EFT: 0 0.00 0.00 0.00 NON CHECKS: 0 0.00 0.00 0.00 VOID CHECKS: 5 VOID DEBITS 0.00 VOID CREDITS 160,327.35CR 160,327.35CR 0.00 TOTAL ERRORS: 0 NO INVOICE AMOUNT DISCOUNTS CHECK AMOUNT VENDOR SET: 01 BANK: * TOTALS: 5 160,327.35CR 0.00 0.00
SLIDE 28
4/21/2015 10:29 AM A/P HISTORY CHECK REPORT PAGE: 2 VENDOR SET: 02 City of Dunwoody, GA BANK: * ALL BANKS DATE RANGE: 1/01/2015 THRU 3/31/2015 CHECK CHECK CHECK CHECK VENDOR I.D. NAME STATUS DATE AMOUNT DISCOUNT NO STATUS AMOUNT 002013 Collinson Media and Events C-CHECK Collinson Media and EvenVOIDED V 1/09/2015 041303 4,500.00CR * * T O T A L S * * NO INVOICE AMOUNT DISCOUNTS CHECK AMOUNT REGULAR CHECKS: 0 0.00 0.00 0.00 HAND CHECKS: 0 0.00 0.00 0.00 DRAFTS: 0 0.00 0.00 0.00 EFT: 0 0.00 0.00 0.00 NON CHECKS: 0 0.00 0.00 0.00 VOID CHECKS: 1 VOID DEBITS 0.00 VOID CREDITS 4,500.00CR 4,500.00CR 0.00 TOTAL ERRORS: 0 NO INVOICE AMOUNT DISCOUNTS CHECK AMOUNT VENDOR SET: 02 BANK: * TOTALS: 1 4,500.00CR 0.00 0.00 BANK: * TOTALS: 6 164,827.35CR 0.00 0.00
SLIDE 29
4/21/2015 10:29 AM A/P HISTORY CHECK REPORT PAGE: 3 VENDOR SET: 01 City of Dunwoody, GA BANK: 01 Suntrust Concentration DATE RANGE: 1/01/2015 THRU 3/31/2015 CHECK CHECK CHECK CHECK VENDOR I.D. NAME STATUS DATE AMOUNT DISCOUNT NO STATUS AMOUNT 001145 ETS Corporation I-January 2015 ETS Corporation D 2/01/2015 000000 100 1516.523900.00 Merchant Services ETS Corporation 1,637.71 1,637.71 001145 ETS Corporation I-February 2015 ETS Corporation D 3/13/2015 000000 100 1516.523900.00 Merchant Services ETS Corporation 1,325.76 1,325.76 001615 PNC Bank, N. A. I-Jan 2015 PNC Bank, N. A. D 1/01/2015 000000 405 8000.582200.01 Lease Interest PNC Bank, N. A. 2,686.13 405 8000.581200.01 Lease Principal PNC Bank, N. A. 6,344.39 I-January 2015 PNC Bank, N. A. D 1/01/2015 000000 405 8000.582200.01 Lease Interest PNC Bank, N. A. 2,666.88 405 8000.581200.01 Lease Principal PNC Bank, N. A. 14,476.56 26,173.96 001615 PNC Bank, N. A. I-Feb 2015 PNC Bank, N. A. D 2/01/2015 000000 405 8000.582200.01 Lease Interest PNC Bank, N. A. 2,665.25 405 8000.581200.01 Lease Principal PNC Bank, N. A. 14,478.19 I-February 2015 PNC Bank, N. A. D 2/01/2015 000000 405 8000.582200.01 Lease Interest PNC Bank, N. A. 2,675.56 405 8000.581200.01 Lease Principal PNC Bank, N. A. 6,354.96 26,173.96 001615 PNC Bank, N. A. I-March 2015 PNC Bank, N. A. D 2/09/2015 000000 405 8000.581200.01 Lease Principal PNC Bank, N. A. 14,748.11 405 8000.582200.01 Lease Interest PNC Bank, N. A. 2,395.33 17,143.44 001615 PNC Bank, N. A. I-Mar 2015 PNC Bank, N. A. D 2/12/2015 000000 405 8000.581200.01 Lease Principal PNC Bank, N. A. 6,365.55 405 8000.582200.01 Lease Interest PNC Bank, N. A. 2,664.97 9,030.52 001615 PNC Bank, N. A. I-April 2015 PNC Bank, N. A. D 3/12/2015 000000 405 8000.581200.01 Lease Principal PNC Bank, N. A. 14,508.40 405 8000.582200.01 Lease Interest PNC Bank, N. A. 2,635.04 17,143.44 001615 PNC Bank, N. A. I-Apr 2015 PNC Bank, N. A. D 3/13/2015 000000 405 8000.581200.01 Lease Principal PNC Bank, N. A. 6,376.16 405 8000.582200.01 Lease Interest PNC Bank, N. A. 2,654.36 9,030.52
SLIDE 30 4/21/2015 10:29 AM A/P HISTORY CHECK REPORT PAGE: 4 VENDOR SET: 01 City of Dunwoody, GA BANK: 01 Suntrust Concentration DATE RANGE: 1/01/2015 THRU 3/31/2015 CHECK CHECK CHECK CHECK VENDOR I.D. NAME STATUS DATE AMOUNT DISCOUNT NO STATUS AMOUNT * * T O T A L S * * NO INVOICE AMOUNT DISCOUNTS CHECK AMOUNT REGULAR CHECKS: 0 0.00 0.00 0.00 HAND CHECKS: 0 0.00 0.00 0.00 DRAFTS: 8 107,659.31 0.00 107,659.31 EFT: 0 0.00 0.00 0.00 NON CHECKS: 0 0.00 0.00 0.00 VOID CHECKS: 0 VOID DEBITS 0.00 VOID CREDITS 0.00 0.00 0.00 TOTAL ERRORS: 0 ** G/L ACCOUNT TOTALS ** G/L ACCOUNT NAME AMOUNT
- 100 1516.523900.00 Merchant Services 2,963.47
*** FUND TOTAL *** 2,963.47 405 8000.581200.01 Lease Principal 83,652.32 405 8000.582200.01 Lease Interest 21,043.52 *** FUND TOTAL *** 104,695.84 NO INVOICE AMOUNT DISCOUNTS CHECK AMOUNT VENDOR SET: 01 BANK: 01 TOTALS: 8 107,659.31 0.00 107,659.31 BANK: 01 TOTALS: 8 107,659.31 0.00 107,659.31
SLIDE 31 4/21/2015 10:29 AM A/P HISTORY CHECK REPORT PAGE: 5 VENDOR SET: 01 City of Dunwoody, GA BANK: 02 Suntrust Payroll Account DATE RANGE: 1/01/2015 THRU 3/31/2015 CHECK CHECK CHECK CHECK VENDOR I.D. NAME STATUS DATE AMOUNT DISCOUNT NO STATUS AMOUNT 000022 ADP I-447399778 ADP D 1/02/2015 000000 100 1512.521200.00 Professional Services ADP 605.85 605.85 * * T O T A L S * * NO INVOICE AMOUNT DISCOUNTS CHECK AMOUNT REGULAR CHECKS: 0 0.00 0.00 0.00 HAND CHECKS: 0 0.00 0.00 0.00 DRAFTS: 1 605.85 0.00 605.85 EFT: 0 0.00 0.00 0.00 NON CHECKS: 0 0.00 0.00 0.00 VOID CHECKS: 0 VOID DEBITS 0.00 VOID CREDITS 0.00 0.00 0.00 TOTAL ERRORS: 0 ** G/L ACCOUNT TOTALS ** G/L ACCOUNT NAME AMOUNT
- 100 1512.521200.00 Professional Services 605.85
*** FUND TOTAL *** 605.85 NO INVOICE AMOUNT DISCOUNTS CHECK AMOUNT VENDOR SET: 01 BANK: 02 TOTALS: 1 605.85 0.00 605.85 BANK: 02 TOTALS: 1 605.85 0.00 605.85
SLIDE 32
4/21/2015 10:29 AM A/P HISTORY CHECK REPORT PAGE: 6 VENDOR SET: 01 City of Dunwoody, GA BANK: 03 Suntrust Disbursement Acc DATE RANGE: 1/01/2015 THRU 3/31/2015 CHECK CHECK CHECK CHECK VENDOR I.D. NAME STATUS DATE AMOUNT DISCOUNT NO STATUS AMOUNT 000022 ADP I-447687524 ADP D 1/09/2015 000000 100 1512.521200.00 Professional Services ADP 93.75 93.75 000022 ADP I-448033414 ADP D 1/16/2015 000000 100 1512.521200.00 Professional Services ADP 526.35 526.35 000022 ADP I-3197577-00 ADP D 2/06/2015 000000 100 0000.121300.01 Fed Withholding Payable ADP 238.57 I-449191816 ADP D 2/06/2015 000000 100 1512.521200.00 Professional Services ADP 538.86 777.43 000022 ADP I-449844564 ADP D 2/13/2015 000000 100 1512.521200.00 Professional Services ADP 550.35 550.35 000022 ADP I-449959966 ADP D 2/19/2015 000000 100 1512.521200.00 Professional Services ADP 556.75 556.75 000022 ADP I-450726832 ADP D 2/27/2015 000000 100 1512.521200.00 Professional Services ADP 538.86 538.86 000022 ADP I-451360912 ADP D 3/13/2015 000000 100 1512.521200.00 Professional Services ADP 525.85 525.85 000022 ADP I-452092702 ADP D 3/27/2015 000000 100 1512.521200.00 Professional Services ADP 538.86 538.86 000025 Clark Patterson Lee I-46 Clark Patterson Lee D 1/14/2015 000000 100 7000.521100.01 Official/Admin Svcs Clark Patterson Lee 119,524.08 119,524.08 000025 Clark Patterson Lee I-47 Clark Patterson Lee D 2/06/2015 000000 100 7000.521100.01 Official/Admin Svcs Clark Patterson Lee 132,250.00 132,250.00 000025 Clark Patterson Lee I-48 Clark Patterson Lee D 2/27/2015 000000 100 7000.521100.01 Official/Admin Svcs Clark Patterson Lee 132,250.00 132,250.00
SLIDE 33
4/21/2015 10:29 AM A/P HISTORY CHECK REPORT PAGE: 7 VENDOR SET: 01 City of Dunwoody, GA BANK: 03 Suntrust Disbursement Acc DATE RANGE: 1/01/2015 THRU 3/31/2015 CHECK CHECK CHECK CHECK VENDOR I.D. NAME STATUS DATE AMOUNT DISCOUNT NO STATUS AMOUNT 000025 Clark Patterson Lee I-49 Clark Patterson Lee D 3/26/2015 000000 100 7000.521100.01 Official/Admin Svcs Clark Patterson Lee 132,250.00 132,250.00 000029 Lowe Engineers, LLC I-15225 Lowe Engineers, LLC D 2/06/2015 000000 100 4100.521100.01 Official/Admin Svcs Lowe Engineers, LLC 18,912.38 100 6200.521100.01 Official/Admin Svcs Lowe Engineers, LLC 16,170.78 560 4320.521100.01 Official/Admin Svcs Lowe Engineers, LLC 8,900.00 43,983.16 000029 Lowe Engineers, LLC I-15284 Lowe Engineers, LLC D 2/26/2015 000000 100 4100.521100.01 Official/Admin Svcs Lowe Engineers, LLC 18,912.37 100 6200.521100.01 Official/Admin Svcs Lowe Engineers, LLC 16,170.78 560 4320.521100.01 Official/Admin Svcs Lowe Engineers, LLC 8,900.00 43,983.15 000029 Lowe Engineers, LLC I-15343 Lowe Engineers, LLC D 3/26/2015 000000 100 4100.521100.01 Official/Admin Svcs Lowe Engineers, LLC 18,912.39 100 6200.521100.01 Official/Admin Svcs Lowe Engineers, LLC 16,170.78 560 4320.521100.01 Official/Admin Svcs Lowe Engineers, LLC 8,900.00 43,983.17 000073 JAT Consulting Services, Inc I-37 JAT Consulting Services, Inc D 2/06/2015 000000 100 1511.521100.01 Official/Admin Svcs JAT Consulting Servi 112,366.58 112,366.58 000073 JAT Consulting Services, Inc I-38 JAT Consulting Services, Inc D 2/28/2015 000000 100 1511.521100.01 Official/Admin Svcs JAT Consulting Servi 112,366.58 112,366.58 000073 JAT Consulting Services, Inc I-39 JAT Consulting Services, Inc D 3/01/2015 000000 100 1511.521100.01 Official/Admin Svcs JAT Consulting Servi 112,366.58 112,366.58 000094 WEX BANK I-39444409 WEX BANK D 1/06/2015 000000 100 3200.531270.00 Gasoline WEX BANK 411.85 I-39451204 WEX BANK D 1/06/2015 000000 100 3200.531270.00 Gasoline WEX BANK 738.16 1,150.01 000094 WEX BANK I-39595837 WEX BANK D 2/06/2015 000000 100 3200.531270.00 Gasoline WEX BANK 10,847.04 I-39785559 WEX BANK D 2/06/2015 000000 100 3200.531270.00 Gasoline WEX BANK 380.89 I-39796785 WEX BANK D 2/06/2015 000000 100 3200.531270.00 Gasoline WEX BANK 1,218.80 12,446.73
SLIDE 34
4/21/2015 10:29 AM A/P HISTORY CHECK REPORT PAGE: 8 VENDOR SET: 01 City of Dunwoody, GA BANK: 03 Suntrust Disbursement Acc DATE RANGE: 1/01/2015 THRU 3/31/2015 CHECK CHECK CHECK CHECK VENDOR I.D. NAME STATUS DATE AMOUNT DISCOUNT NO STATUS AMOUNT 000094 WEX BANK I-39940023 WEX BANK D 2/23/2015 000000 100 3200.531270.00 Gasoline WEX BANK 10,304.22 10,304.22 000094 WEX BANK I-40160999 WEX BANK D 3/06/2015 000000 100 3200.531270.00 Gasoline WEX BANK 828.10 828.10 000094 WEX BANK I-40284518 WEX BANK D 3/23/2015 000000 100 3200.531270.00 Gasoline WEX BANK 10,867.59 10,867.59 000137 Medcom Services, Inc I-1/3/2015 Medcom Services, Inc D 1/03/2015 000000 100 0000.121300.16 Flex Spending Ded Payable Medcom Services, Inc 182.30 182.30 000137 Medcom Services, Inc I-1/10/2015 Medcom Services, Inc D 1/10/2015 000000 100 0000.121300.16 Flex Spending Ded Payable Medcom Services, Inc 833.13 833.13 000137 Medcom Services, Inc I-1/17/2015 Medcom Services, Inc D 1/17/2015 000000 100 0000.121300.16 Flex Spending Ded Payable Medcom Services, Inc 494.32 494.32 000137 Medcom Services, Inc I-1/24/2015 Medcom Services, Inc D 2/06/2015 000000 100 0000.121300.16 Flex Spending Ded Payable Medcom Services, Inc 820.00 I-1/31/2015 Medcom Services, Inc D 2/06/2015 000000 100 0000.121300.16 Flex Spending Ded Payable Medcom Services, Inc 1,632.02 2,452.02 000137 Medcom Services, Inc I-2/7/2015 Medcom Services, Inc D 2/07/2015 000000 100 0000.121300.16 Flex Spending Ded Payable Medcom Services, Inc 2,898.16 2,898.16 000137 Medcom Services, Inc I-2/14/2015 Medcom Services, Inc D 2/14/2015 000000 100 0000.121300.16 Flex Spending Ded Payable Medcom Services, Inc 1,755.45 1,755.45 000137 Medcom Services, Inc I-2/21/2015 Medcom Services, Inc D 2/21/2015 000000 100 0000.121300.16 Flex Spending Ded Payable Medcom Services, Inc 1,883.89 1,883.89 000137 Medcom Services, Inc I-2/28/2015 Medcom Services, Inc D 2/28/2015 000000 100 0000.121300.16 Flex Spending Ded Payable Medcom Services, Inc 921.03 921.03
SLIDE 35
4/21/2015 10:29 AM A/P HISTORY CHECK REPORT PAGE: 9 VENDOR SET: 01 City of Dunwoody, GA BANK: 03 Suntrust Disbursement Acc DATE RANGE: 1/01/2015 THRU 3/31/2015 CHECK CHECK CHECK CHECK VENDOR I.D. NAME STATUS DATE AMOUNT DISCOUNT NO STATUS AMOUNT 000137 Medcom Services, Inc I-3/7/2015 Medcom Services, Inc D 3/07/2015 000000 100 0000.121300.16 Flex Spending Ded Payable Medcom Services, Inc 683.25 683.25 000137 Medcom Services, Inc I-3/14/2015 Medcom Services, Inc D 3/14/2015 000000 100 0000.121300.16 Flex Spending Ded Payable Medcom Services, Inc 887.30 887.30 000137 Medcom Services, Inc I-3/21/2015 Medcom Services, Inc D 3/21/2015 000000 100 0000.121300.16 Flex Spending Ded Payable Medcom Services, Inc 865.81 865.81 000137 Medcom Services, Inc I-3/28/2015 Medcom Services, Inc D 3/28/2015 000000 100 0000.121300.16 Flex Spending Ded Payable Medcom Services, Inc 567.17 567.17 000271 Georgia Bureau of Investigatio I-031-252428 Georgia Bureau of Investigatio D 2/01/2015 000000 100 3200.521300.00 Technical Svcs Georgia Bureau of In 204.75 204.75 000271 Georgia Bureau of Investigatio I-059-252916 Georgia Bureau of Investigatio D 3/01/2015 000000 100 3200.521300.00 Technical Svcs Georgia Bureau of In 42.50 42.50 001419 Mulcahy Accounting & Risk Cons I-2015-1 Mulcahy Accounting & Risk Cons D 3/09/2015 000000 100 1511.521200.00 Professional Services Mulcahy Accounting & 1,291.66 I-2015-2 Mulcahy Accounting & Risk Cons D 3/09/2015 000000 100 1511.521200.00 Professional Services Mulcahy Accounting & 1,291.66 I-2015-3 Mulcahy Accounting & Risk Cons D 3/09/2015 000000 100 1511.521200.00 Professional Services Mulcahy Accounting & 1,291.66 3,874.98 001421 Chattahoochee River 911 Author I-January 2015 Chattahoochee River 911 Author D 1/21/2015 000000 215 3800.571000.00 Intergovernmental-E911 Chattahoochee River 93,750.00 93,750.00 001421 Chattahoochee River 911 Author I-February 2015 Chattahoochee River 911 Author D 2/01/2015 000000 215 3800.571000.00 Intergovernmental-E911 Chattahoochee River 93,750.00 93,750.00 001421 Chattahoochee River 911 Author I-Mar 2015 Chattahoochee River 911 Author D 3/13/2015 000000 215 3800.571000.00 Intergovernmental-E911 Chattahoochee River 93,750.00 93,750.00
SLIDE 36
4/21/2015 10:29 AM A/P HISTORY CHECK REPORT PAGE: 10 VENDOR SET: 01 City of Dunwoody, GA BANK: 03 Suntrust Disbursement Acc DATE RANGE: 1/01/2015 THRU 3/31/2015 CHECK CHECK CHECK CHECK VENDOR I.D. NAME STATUS DATE AMOUNT DISCOUNT NO STATUS AMOUNT 001480 Interdev, LLC I-1004086 Interdev, LLC D 2/06/2015 000000 100 1535.521100.01 Official/Admin Svcs Interdev, LLC 27,159.90 27,159.90 001480 Interdev, LLC I-1004172 Interdev, LLC D 2/28/2015 000000 100 1535.521100.01 Official/Admin Svcs Interdev, LLC 27,159.90 27,159.90 001480 Interdev, LLC I-1004241 Interdev, LLC D 3/31/2015 000000 100 1535.521100.01 Official/Admin Svcs Interdev, LLC 38,173.50 38,173.50 001551 Jacobs I-EEXF9503-FEB15 Jacobs D 2/06/2015 000000 100 1570.521100.01 Official/Admin Svcs Jacobs 25,662.75 25,662.75 001551 Jacobs I-EEXF9503-MAR15 Jacobs D 2/25/2015 000000 100 1570.521100.01 Official/Admin Svcs Jacobs 25,662.75 25,662.75 001551 Jacobs I-EEXF9503-APR15 Jacobs D 3/26/2015 000000 100 1570.521100.01 Official/Admin Svcs Jacobs 25,662.75 25,662.75 001685 J.P. Morgan Chase Commercial C I-Jan 2015 J.P. Morgan Chase Commercial C D 1/26/2015 000000 100 0000.121110.00 PCard A/P Control J.P. Morgan Chase Co 126,302.95 126,302.95 001685 J.P. Morgan Chase Commercial C I-February 2015 J.P. Morgan Chase Commercial C D 3/13/2015 000000 100 0000.121110.00 PCard A/P Control J.P. Morgan Chase Co 198,453.88 198,453.88 001685 J.P. Morgan Chase Commercial C I-March 2015 J.P. Morgan Chase Commercial C D 3/26/2015 000000 100 0000.121100.00 AP Pending (Pooled Cash) J.P. Morgan Chase Co 195,376.54 195,376.54 000008 CIT Technology Fin Serv Inc I-26241455 CIT Technology Fin Serv Inc R 1/09/2015 018870 100 1565.522300.00 Rentals CIT Technology Fin S 733.00 733.00 000061 Blue Cross Blue Shield I-000546884G Blue Cross Blue Shield R 1/09/2015 018871 100 1110.512100.00 Group Insurance Blue Cross Blue Shie 3,847.73 100 1330.512100.00 Group Insurance Blue Cross Blue Shie 1,074.54 100 1511.512100.00 Group Insurance Blue Cross Blue Shie 1,560.65 100 2650.512100.00 Group Insurance Blue Cross Blue Shie 2,074.19 100 3200.512100.00 Group Insurance Blue Cross Blue Shie 64,039.34 100 4100.512100.00 Group Insurance Blue Cross Blue Shie 1,560.65 74,157.10
SLIDE 37
4/21/2015 10:29 AM A/P HISTORY CHECK REPORT PAGE: 11 VENDOR SET: 01 City of Dunwoody, GA BANK: 03 Suntrust Disbursement Acc DATE RANGE: 1/01/2015 THRU 3/31/2015 CHECK CHECK CHECK CHECK VENDOR I.D. NAME STATUS DATE AMOUNT DISCOUNT NO STATUS AMOUNT 000074 Standard Insurance I-January 2015 Standard Insurance R 1/09/2015 018872 100 1330.512100.00 Group Insurance Standard Insurance 106.99 100 1511.512100.00 Group Insurance Standard Insurance 161.19 100 4100.512100.00 Group Insurance Standard Insurance 136.34 100 2650.512100.00 Group Insurance Standard Insurance 254.11 100 3200.512100.00 Group Insurance Standard Insurance 4,328.47 4,987.10 000079 ConnectSouth I-1317 Connect South R 1/09/2015 018873 100 1530.521200.00 Prof Svcs Connect South 63,000.00 63,000.00 000118 Peace Officers' I-January 2015 Peace Officers' R 1/09/2015 018874 100 0000.121300.15 POAB Deduction Payable Peace Officers' 640.00 640.00 000129 Verizon Wireless Services LLC I-9737139802 Verizon Wireless R 1/09/2015 018875 100 1110.523200.00 Communications Verizon Wireless 64.12 100 1110.523200.00 Communications Verizon Wireless 38.01 100 1320.523200.00 Communications Verizon Wireless 139.64 100 1330.523200.00 Communications Verizon Wireless 94.39 100 1511.523200.00 Communications Verizon Wireless 97.14 100 2650.523200.00 Communications Verizon Wireless 60.62 100 3200.523200.00 Communications Verizon Wireless 6,468.07 100 4100.523200.00 Communications Verizon Wireless 98.88 100 6200.523200.00 Communications Verizon Wireless 38.01 7,098.88 000149 AT&T I-January 2015 AT&T R 1/09/2015 018876 100 1535.523200.00 Communications AT&T 124.08 124.08 000150 Fidelity Security Life Insuran I-9677012 Fidelity Security Life Insuran R 1/09/2015 018877 100 0000.121300.12 EE-Vision Payable Fidelity Security Li 470.08 470.08 000151 Wolfe, Timothy W. I-December 2014 Wolfe, Timothy W. R 1/09/2015 018878 100 2650.521200.00 Prof Svcs Wolfe, Timothy W. 700.00 700.00 000160 Georgia Technology Authority I-924-660881214 Georgia Technology Authority R 1/09/2015 018879 100 3200.521300.00 Technical Svcs Georgia Technology A 39.41 39.41
SLIDE 38
4/21/2015 10:29 AM A/P HISTORY CHECK REPORT PAGE: 12 VENDOR SET: 01 City of Dunwoody, GA BANK: 03 Suntrust Disbursement Acc DATE RANGE: 1/01/2015 THRU 3/31/2015 CHECK CHECK CHECK CHECK VENDOR I.D. NAME STATUS DATE AMOUNT DISCOUNT NO STATUS AMOUNT 000163 Metro Materials Inc. I-37974 Metro Materials Inc. R 1/09/2015 018880 100 4200.531100.00 Supplies Metro Materials Inc. 1,330.77 1,330.77 000165 Vulcan Materials Company I-21212012864 Vulcan Materials Company R 1/09/2015 018881 560 4320.531100.00 Supplies Vulcan Materials Com 587.50 587.50 000206 Georgia Power I-09153-15043/Dec 14 Georgia Power R 1/09/2015 018882 100 6200.531230.00 Utilities Georgia Power 24.38 24.38 000206 Georgia Power I-24953-72008/Dec 14 Georgia Power R 1/09/2015 018883 100 6200.531230.00 Utilities Georgia Power 123.68 123.68 000206 Georgia Power I-December 2014 Georgia Power R 1/09/2015 018884 100 4100.531230.00 Electricity Georgia Power 37,170.54 100 6200.531230.00 Utilities Georgia Power 6,964.89 44,135.43 000211 GIRMA I-219295 GIRMA R 1/09/2015 018885 100 4200.523100.01 Insurance Claims GIRMA 40.00 40.00 000245 FedEx I-2-804-29620 FedEx R 1/09/2015 018886 100 3200.523200.00 Communications FedEx 23.36 23.36 000249 Municipal Code Corporation I-00250450 Municipal Code Corporation R 1/09/2015 018887 100 1330.521200.00 Prof Svcs Municipal Code Corpo 781.39 781.39 000331 Tyler Technologies, Inc I-025-112640 Tyler Technologies, Inc R 1/09/2015 018888 100 2650.522200.00 Repairs & Maintenance Tyler Technologies, 200.00 200.00 001009 Kimley-Horn and Associates, In I-019124000-0714 Kimley-Horn and Associates, In R 1/09/2015 018889 350 4200.541400.00 Infrastructure Kimley-Horn and Asso 1,762.51 I-019124002-0814 Kimley-Horn and Associates, In R 1/09/2015 018889 350 6200.541400.00 Infrastructure Kimley-Horn and Asso 9,930.34 I-019124002-0914 Kimley-Horn and Associates, In R 1/09/2015 018889 350 6200.541400.00 Infrastructure Kimley-Horn and Asso 6,110.98 17,803.83
SLIDE 39
4/21/2015 10:29 AM A/P HISTORY CHECK REPORT PAGE: 13 VENDOR SET: 01 City of Dunwoody, GA BANK: 03 Suntrust Disbursement Acc DATE RANGE: 1/01/2015 THRU 3/31/2015 CHECK CHECK CHECK CHECK VENDOR I.D. NAME STATUS DATE AMOUNT DISCOUNT NO STATUS AMOUNT 001023 Victoria Clearfield I-December 2014 Victoria Clearfield R 1/09/2015 018890 100 2650.521300.00 Technical Svcs Victoria Clearfield 900.00 900.00 001026 Guardian - Appleton I-January 2015 Guardian - Appleton R 1/09/2015 018891 100 1110.512100.00 Group Insurance Guardian - Appleton 296.40 100 1320.512100.00 Group Insurance Guardian - Appleton 131.09 100 1330.512100.00 Group Insurance Guardian - Appleton 71.67 100 1511.512100.00 Group Insurance Guardian - Appleton 131.09 100 2650.512100.00 Group Insurance Guardian - Appleton 162.10 100 3200.512100.00 Group Insurance Guardian - Appleton 4,801.26 100 4100.512100.00 Group Insurance Guardian - Appleton 131.09 5,724.70 001086 Schiff Hardin LLP I-1960752 Schiff Hardin LLP R 1/09/2015 018892 100 1530.521200.02 Prof Svcs-Litigation Schiff Hardin LLP 2,361.51 2,361.51 001187 APG PCE, LLC I-January 2015 APG PCE, LLC R 1/09/2015 018893 100 1565.531230.00 Electricity APG PCE, LLC 2,812.12 2,812.12 001198 Adrian Security Co. I-29909 Adrian Security Co. R 1/09/2015 018894 100 6200.522200.06 R&M-Parks Adrian Security Co. 329.00 329.00 001328 LexisNexis Risk Data Managemen I-1502895-20141231 LexisNexis Risk Data Managemen R 1/09/2015 018895 100 1511.521300.00 Technical Services LexisNexis Risk Data 50.00 50.00 001333 E. Harriman Construction, Inc. I-1230-14 E. Harriman Construction, Inc. R 1/09/2015 018896 100 6200.522200.06 R&M-Parks E. Harriman Construc 11,865.00 I-14-1230 E. Harriman Construction, Inc. R 1/09/2015 018896 100 4200.522200.02 R&M - Street Maintenance E. Harriman Construc 2,401.00 14,266.00 001415 Rite Way I-366116 Rite Way R 1/09/2015 018897 100 6200.522200.06 R&M-Parks Rite Way 1,621.32 1,621.32 001434 Michael M. Hawkins I-672/December 2014 Michael M. Hawkins R 1/09/2015 018898 100 2650.521200.00 Prof Svcs Michael M. Hawkins 2,100.00 2,100.00
SLIDE 40
4/21/2015 10:29 AM A/P HISTORY CHECK REPORT PAGE: 14 VENDOR SET: 01 City of Dunwoody, GA BANK: 03 Suntrust Disbursement Acc DATE RANGE: 1/01/2015 THRU 3/31/2015 CHECK CHECK CHECK CHECK VENDOR I.D. NAME STATUS DATE AMOUNT DISCOUNT NO STATUS AMOUNT 001549 Gas South, LLC I-2739627154-Dec 14 Gas South, LLC R 1/09/2015 018899 100 6200.531230.00 Utilities Gas South, LLC 573.10 I-December 2014 Gas South, LLC R 1/09/2015 018899 100 6200.531230.00 Utilities Gas South, LLC 755.10 1,328.20 001565 Georgia Development Partners, I-GD147DoorsMW Georgia Development Partners, R 1/09/2015 018900 100 6200.522200.06 R&M-Parks Georgia Development 13,294.66 13,294.66 00159b Pitney Bowes Global Financial I-9938656-DC14 Pitney Bowes Global Financial R 1/09/2015 018901 100 1565.522300.00 Rentals Pitney Bowes Global 771.00 771.00 001645 Hyland Software, Inc. I-286862 Hyland Software, Inc. R 1/09/2015 018902 100 1330.522200.00 Repairs & Maintenance Hyland Software, Inc 1,760.00 1,760.00 001656 De Lage Landen I-43931247 De Lage Landen R 1/09/2015 018903 100 3200.522300.00 Rentals De Lage Landen 304.00 304.00 001673 Aerial Innovations of Ga., Inc I-44921 Aerial Innovations of Ga., Inc R 1/09/2015 018904 100 7000.521300.00 Technical Svcs Aerial Innovations o 91.50 I-44922 Aerial Innovations of Ga., Inc R 1/09/2015 018904 100 7000.521300.00 Technical Svcs Aerial Innovations o 94.50 186.00 001719 Perimeter Community Improvemen I-PCID 12876(1) Perimeter Community Improvemen R 1/09/2015 018905 250 4005.541400.14 Commuter Trail-Infrastructure Perimeter Community 1,596.67 1,596.67 001731 David Zagoria I-Joey Williams David Zagoria R 1/09/2015 018906 100 2650.521200.04 Prof Svcs-Public Defender David Zagoria 117.50 117.50 001756 Georgia Snacks I-116 Georgia Snacks R 1/09/2015 018907 100 1540.512900.00 Other Employment Benefits Georgia Snacks 1,000.00 1,000.00 001802 WebQA, Inc. I-1009-141201 WebQA, Inc. R 1/09/2015 018908 100 1330.522200.00 Repairs & Maintenance WebQA, Inc. 3,600.00 3,600.00
SLIDE 41
4/21/2015 10:29 AM A/P HISTORY CHECK REPORT PAGE: 15 VENDOR SET: 01 City of Dunwoody, GA BANK: 03 Suntrust Disbursement Acc DATE RANGE: 1/01/2015 THRU 3/31/2015 CHECK CHECK CHECK CHECK VENDOR I.D. NAME STATUS DATE AMOUNT DISCOUNT NO STATUS AMOUNT 001824 Veith Traffic Services, LLC I-3011-8 Veith Traffic Services, LLC R 1/09/2015 018909 100 4200.522200.03 R&M - Traffic Signals Veith Traffic Servic 400.00 400.00 001825 Randstad US LP I-R17062638 Randstad US LP R 1/09/2015 018910 100 7000.522200.00 Repairs & Maintenance Randstad US LP 523.00 I-R17098015 Randstad US LP R 1/09/2015 018910 100 7000.522200.00 Repairs & Maintenance Randstad US LP 352.00 875.00 001833 Marny Heit I-Carol Sullivan Marny Heit R 1/09/2015 018911 100 2650.521200.04 Prof Svcs-Public Defender Marny Heit 190.00 190.00 001862 Design Seven, Inc. I-02DPD14 Design Seven, Inc. R 1/09/2015 018912 100 1570.523200.00 Communications Design Seven, Inc. 1,500.00 1,500.00 1 Amanda Head I-Amanda Head Amanda Head: R 1/09/2015 018913 100 3200.522200.02 Repairs & Maintenance-Vehicle Amanda Head: 171.95 171.95 1 Trina Gallien I-Tuition-T. Gallien Trina Gallien: R 1/09/2015 018914 100 2650.511100.00 Regular Salaries Trina Gallien: 20.01 20.01 000226 FBI CAAA I-Fladrich-Jan 2015 Georgia Chapter FBINAA: R 1/14/2015 018915 100 3200.523700.00 Education & Training Georgia Chapter FBIN 50.00 50.00 000061 Blue Cross Blue Shield I-000552986G Blue Cross Blue Shield R 1/23/2015 018916 100 1110.512100.00 Group Insurance Blue Cross Blue Shie 3,847.73 100 1320.512100.00 Group Insurance Blue Cross Blue Shie 1,560.65 100 1330.512100.00 Group Insurance Blue Cross Blue Shie 1,074.54 100 1511.512100.00 Group Insurance Blue Cross Blue Shie 1,560.65 100 2650.512100.00 Group Insurance Blue Cross Blue Shie 2,074.19 100 3200.512100.00 Group Insurance Blue Cross Blue Shie 60,780.40 100 4100.512100.00 Group Insurance Blue Cross Blue Shie 1,560.65 72,458.81 000138 Riley McLendon, LLC I-62583 Riley McLendon, LLC R 1/23/2015 018917 100 1530.521200.01 Prof Svcs-Legal Riley McLendon, LLC 12,500.00 I-62584 Riley McLendon, LLC R 1/23/2015 018917 100 1530.521200.02 Prof Svcs-Litigation Riley McLendon, LLC 3,705.00 I-62585 Riley McLendon, LLC R 1/23/2015 018917 100 2650.521200.03 Prof Svcs-Court Solicitor Riley McLendon, LLC 5,010.00 I-62586 Riley McLendon, LLC R 1/23/2015 018917
SLIDE 42
4/21/2015 10:29 AM A/P HISTORY CHECK REPORT PAGE: 16 VENDOR SET: 01 City of Dunwoody, GA BANK: 03 Suntrust Disbursement Acc DATE RANGE: 1/01/2015 THRU 3/31/2015 CHECK CHECK CHECK CHECK VENDOR I.D. NAME STATUS DATE AMOUNT DISCOUNT NO STATUS AMOUNT 000138 Riley McLendon, LLC CONT I-62586 Riley McLendon, LLC R 1/23/2015 018917 100 1530.521200.01 Prof Svcs-Legal Riley McLendon, LLC 18.00 I-62587 Riley McLendon, LLC R 1/23/2015 018917 350 4200.541400.00 Infrastructure Riley McLendon, LLC 650.02 21,883.02 000149 AT&T I-Jan 2015 AT&T R 1/23/2015 018918 100 1535.523200.00 Communications AT&T 117.65 117.65 000156 Powell, Hugh R I-1983 Powell, Hugh R R 1/23/2015 018919 100 2650.521200.00 Prof Svcs Powell, Hugh R 800.00 800.00 000159 Purchase Power I-December 2014 Purchase Power R 1/23/2015 018920 100 1110.523200.00 Communications Purchase Power 11.94 100 1330.523200.00 Communications Purchase Power 11.52 100 1512.523200.00 Communications Purchase Power 164.37 100 1516.523200.00 Communications Purchase Power 131.16 100 1517.523200.00 Communications Purchase Power 856.26 100 1530.523200.00 Communications Purchase Power 27.20 100 1540.523200.00 Communications Purchase Power 3.84 100 2650.523200.00 Communications Purchase Power 280.97 100 3200.523200.00 Communications Purchase Power 100.83 100 4100.523200.00 Communications Purchase Power 69.11 100 7000.523200.00 Communications Purchase Power 357.80 2,015.00 000165 Vulcan Materials Company I-11091086 Vulcan Materials Company R 1/23/2015 018921 100 4200.531100.00 Supplies Vulcan Materials Com 507.05 I-21212012533 Vulcan Materials Company R 1/23/2015 018921 100 4200.531100.00 Supplies Vulcan Materials Com 491.25 998.30 000196 Georgia Management Agency, Inc I-58954 Georgia Management Agency, Inc R 1/23/2015 018922 100 4200.522200.02 R&M - Street Maintenance Georgia Management A 34,077.80 560 4320.522200.00 Repairs & Maintenance Georgia Management A 26,088.90 I-58955 Georgia Management Agency, Inc R 1/23/2015 018922 100 4200.522200.02 R&M - Street Maintenance Georgia Management A 17,517.20 I-58956 Georgia Management Agency, Inc R 1/23/2015 018922 100 4200.522200.02 R&M - Street Maintenance Georgia Management A 380.00 78,063.90
SLIDE 43
4/21/2015 10:29 AM A/P HISTORY CHECK REPORT PAGE: 17 VENDOR SET: 01 City of Dunwoody, GA BANK: 03 Suntrust Disbursement Acc DATE RANGE: 1/01/2015 THRU 3/31/2015 CHECK CHECK CHECK CHECK VENDOR I.D. NAME STATUS DATE AMOUNT DISCOUNT NO STATUS AMOUNT 000206 Georgia Power I-09147-88024/Dec 14 Georgia Power R 1/23/2015 018923 100 6200.531230.00 Utilities Georgia Power 69.42 69.42 000206 Georgia Power I-09147-88024/Nov 14 Georgia Power R 1/23/2015 018924 100 6200.531230.00 Utilities Georgia Power 57.31 57.31 000206 Georgia Power I-09147-88024/Oct 14 Georgia Power R 1/23/2015 018925 100 6200.531230.00 Utilities Georgia Power 37.13 37.13 000216 Strategic Datacom Inc I-8736 Strategic Datacom Inc R 1/23/2015 018926 100 3200.522200.00 Repairs & Maintenance Strategic Datacom In 187.50 187.50 000245 FedEx I-2-885-85562 FedEx R 1/23/2015 018927 212 3200.521300.00 Technical Services FedEx 17.86 17.86 000269 DeKalb County Georgia I-5986738/Oct 2014 DeKalb County Georgia R 1/23/2015 018928 100 6200.531230.00 Utilities DeKalb County Georgi 32.83 32.83 000307 DeKalb County District Attorne I-14CV4155-1 DeKalb County District Attorne R 1/23/2015 018929 212 0000.351320.00 Cash Confiscation DeKalb County Distri 80.00 212 0000.351320.00 Cash Confiscation DeKalb County Distri 1,392.00 1,472.00 000307 DeKalb County District Attorne I-14CV6972-5 DeKalb County District Attorne R 1/23/2015 018930 212 0000.351320.00 Cash Confiscation DeKalb County Distri 480.00 212 0000.351320.00 Cash Confiscation DeKalb County Distri 2,400.70 2,880.70 000331 Tyler Technologies, Inc I-025-113463 Tyler Technologies, Inc R 1/23/2015 018931 100 2650.522200.00 Repairs & Maintenance Tyler Technologies, 1,013.00 1,013.00 001009 Kimley-Horn and Associates, In I-019124000-114 Kimley-Horn and Associates, In R 1/23/2015 018932 350 4200.541400.00 Infrastructure Kimley-Horn and Asso 7,385.26 7,385.26 001026 Guardian - Appleton I-February 2015 Guardian - Appleton R 1/23/2015 018933 100 1110.512100.00 Group Insurance Guardian - Appleton 296.40 100 1330.512100.00 Group Insurance Guardian - Appleton 71.67 100 1511.512100.00 Group Insurance Guardian - Appleton 131.09 100 2650.512100.00 Group Insurance Guardian - Appleton 162.10
SLIDE 44
4/21/2015 10:29 AM A/P HISTORY CHECK REPORT PAGE: 18 VENDOR SET: 01 City of Dunwoody, GA BANK: 03 Suntrust Disbursement Acc DATE RANGE: 1/01/2015 THRU 3/31/2015 CHECK CHECK CHECK CHECK VENDOR I.D. NAME STATUS DATE AMOUNT DISCOUNT NO STATUS AMOUNT 001026 Guardian - Appleton CONT I-February 2015 Guardian - Appleton R 1/23/2015 018933 100 3200.512100.00 Group Insurance Guardian - Appleton 4,719.79 100 4100.512100.00 Group Insurance Guardian - Appleton 131.09 5,512.14 001097 US Department of Homeland Secu I-SAVE-342508 US Department of Homeland Secu R 1/23/2015 018934 100 1516.521300.00 Technical Services US Department of Hom 25.00 25.00 001113 Southeast Stormwater Associati I-DF14-2-34 Southeast Stormwater Associati R 1/23/2015 018935 560 4320.521200.09 Prof Svcs-Stormwater Southeast Stormwater 500.00 500.00 001176 SCVS Mobile I-000178 SCVS Mobile R 1/23/2015 018936 100 3200.522200.00 Repairs & Maintenance SCVS Mobile 440.00 440.00 001187 APG PCE, LLC I-PC41-100/Feb 2015 APG PCE, LLC R 1/23/2015 018937 100 0000.123310.00 Abated Rent APG PCE, LLC 42,754.13 42,754.13 001196 Georgia Recreation and Park As I-131 Georgia Recreation and Park As R 1/23/2015 018938 100 6200.523600.00 Dues & Fees Georgia Recreation a 50.00 50.00 001274 Nova Engineering and Environme I-0100805 Nova Engineering and Environme R 1/23/2015 018939 350 4200.541400.00 Infrastructure Nova Engineering and 5,165.00 I-0101903 Nova Engineering and Environme R 1/23/2015 018939 350 4200.522200.00 Repairs & Maintenance Nova Engineering and 1,280.00 6,445.00 001316 Lose and Associates I-20141223 Lose and Associates R 1/23/2015 018940 350 6200.541200.00 Site improvements Lose and Associates 6,413.15 6,413.15 001333 E. Harriman Construction, Inc. I-0108-15 E. Harriman Construction, Inc. R 1/23/2015 018941 350 1565.541300.00 Buildings E. Harriman Construc 35,640.00 35,640.00 001345 JEL Consulting Group, LLC I-214 JEL Consulting Group, LLC R 1/23/2015 018942 100 7500.521200.00 Professional Services JEL Consulting Group 2,500.00 2,500.00
SLIDE 45
4/21/2015 10:29 AM A/P HISTORY CHECK REPORT PAGE: 19 VENDOR SET: 01 City of Dunwoody, GA BANK: 03 Suntrust Disbursement Acc DATE RANGE: 1/01/2015 THRU 3/31/2015 CHECK CHECK CHECK CHECK VENDOR I.D. NAME STATUS DATE AMOUNT DISCOUNT NO STATUS AMOUNT 001347 Anheuser Marketing I-127135 Anheuser Marketing R 1/23/2015 018943 100 3200.531100.01 Supplies-Explorer Program Anheuser Marketing 47.71 47.71 001385 Wolverton and Associates, Inc. I-39998 Wolverton and Associates, Inc. R 1/23/2015 018944 350 4200.541400.00 Infrastructure Wolverton and Associ 4,179.64 4,179.64 001415 Rite Way I-366620 Rite Way R 1/23/2015 018945 100 6200.522200.06 R&M-Parks Rite Way 4,145.90 4,145.90 001418 Trust Security Inc I-R102408 Trust Security Inc R 1/23/2015 018946 100 3200.521300.00 Technical Svcs Trust Security Inc 48.00 48.00 001444 Kenneth Wickham I-1/7/2015 Kenneth Wickham R 1/23/2015 018947 100 2650.521200.00 Prof Svcs Kenneth Wickham 400.00 400.00 001481 Unitrends Corporation I-57802 Unitrends Corporation R 1/23/2015 018948 100 1535.522200.00 Repairs & Maintenance Unitrends Corporatio 500.00 500.00 001492 James Duncan and Associates, I I-386-14-06 James Duncan and Associates, I R 1/23/2015 018949 100 7000.521200.00 Prof Svcs James Duncan and Ass 5,445.00 5,445.00 001650 American United Life Insurance I-20141201AR01 American United Life Insurance R 1/23/2015 018950 100 1540.512900.00 Other Employment Benefits American United Life 312.50 312.50 001673 Aerial Innovations of Ga., Inc I-45009 Aerial Innovations of Ga., Inc R 1/23/2015 018951 100 7000.521300.00 Technical Svcs Aerial Innovations o 91.50 I-45032 Aerial Innovations of Ga., Inc R 1/23/2015 018951 100 7000.521300.00 Technical Svcs Aerial Innovations o 94.50 186.00 001712 Mulkey, Inc. I-2014066.00-5 Mulkey, Inc. R 1/23/2015 018952 350 4200.541400.00 Infrastructure Mulkey, Inc. 2,485.00 2,485.00 001719 Perimeter Community Improvemen I-PCID 2014-01 (6) Perimeter Community Improvemen R 1/23/2015 018953 250 4002.522200.12 Repairs & Maintenance - PTOP Perimeter Community 33,918.28 33,918.28
SLIDE 46
4/21/2015 10:29 AM A/P HISTORY CHECK REPORT PAGE: 20 VENDOR SET: 01 City of Dunwoody, GA BANK: 03 Suntrust Disbursement Acc DATE RANGE: 1/01/2015 THRU 3/31/2015 CHECK CHECK CHECK CHECK VENDOR I.D. NAME STATUS DATE AMOUNT DISCOUNT NO STATUS AMOUNT 001731 David Zagoria I-Beatrice Benbow David Zagoria R 1/23/2015 018954 100 2650.521200.04 Prof Svcs-Public Defender David Zagoria 82.50 I-Howard Stallings David Zagoria R 1/23/2015 018954 100 2650.521200.04 Prof Svcs-Public Defender David Zagoria 122.50 I-O'Reilly David Zagoria R 1/23/2015 018954 100 2650.521200.04 Prof Svcs-Public Defender David Zagoria 117.50 322.50 001739 Kelly Michael Hundley, LLC I-246 Kelly Michael Hundley, LLC R 1/23/2015 018955 100 1530.521200.02 Prof Svcs-Litigation Kelly Michael Hundle 210.00 210.00 001758 Corporate Health Partners, LLC I-3776 Corporate Health Partners, LLC R 1/23/2015 018956 100 1540.512900.00 Other Employment Benefits Corporate Health Par 1,825.33 1,825.33 001780 Partners Risk Services, LLC I-95061 Partners Risk Services, LLC R 1/23/2015 018957 100 3200.512700.00 Workers' Compensation Partners Risk Servic 5,000.00 5,000.00 001784 Peak Democracy, Inc. I-525 Peak Democracy, Inc. R 1/23/2015 018958 100 1570.521300.00 Technical Services Peak Democracy, Inc. 2,250.00 2,250.00 001787 Optech RWM, LLC I-D1214 Optech RWM, LLC R 1/23/2015 018959 100 6200.522200.06 R&M-Parks Optech RWM, LLC 21,279.50 100 6200.522200.06 R&M-Parks Optech RWM, LLC 3,120.18 100 4200.522200.05 R&M - Right of Way Maint Optech RWM, LLC 1,666.66 26,066.34 001799 Colliers International - Atlan I-1/23/2015 Colliers International - Atlan R 1/23/2015 018960 100 0000.381100.00 Rental Commissions Colliers Internation 362.25 362.25 001825 Randstad US LP I-R17191041 Randstad US LP R 1/23/2015 018961 100 7000.522200.00 Repairs & Maintenance Randstad US LP 145.42 145.42 001848 EQ - The Environmental Quality I-116943 EQ - The Environmental Quality R 1/23/2015 018962 100 7000.521300.00 Technical Svcs EQ - The Environment 14,520.94 I-121250 EQ - The Environmental Quality R 1/23/2015 018962 100 7000.521300.00 Technical Svcs EQ - The Environment 1,518.13 16,039.07
SLIDE 47
4/21/2015 10:29 AM A/P HISTORY CHECK REPORT PAGE: 21 VENDOR SET: 01 City of Dunwoody, GA BANK: 03 Suntrust Disbursement Acc DATE RANGE: 1/01/2015 THRU 3/31/2015 CHECK CHECK CHECK CHECK VENDOR I.D. NAME STATUS DATE AMOUNT DISCOUNT NO STATUS AMOUNT 001855 Adapture Technology Group LLC I-SRPI56356 Adapture Technology Group LLC R 1/23/2015 018963 350 1535.542000.00 Machinery & Equipment Adapture Technology 9,908.19 9,908.19 001861 EmpowerD Wellness I-Contract EmpowerD Wellness R 1/23/2015 018964 100 1540.512900.00 Other Employment Benefits EmpowerD Wellness 1,565.42 1,565.42 001864 Dunwoody Stage Door Players, I I-SDP0011 Dunwoody Stage Door Players, I R 1/23/2015 018965 100 1570.523200.00 Communications Dunwoody Stage Door 1,000.00 1,000.00 001865 James Kelley Construction I-50% Deposit James Kelley Construction R 1/23/2015 018966 100 1565.522200.00 Repairs & Maintenance James Kelley Constru 2,850.00 2,850.00 1 Davis Permits I-Davis Permits Davis Permits: R 1/23/2015 018967 100 0000.323100.00 Bldg Structures & Equipment Davis Permits: 50.00 50.00 1 Donnie Davenport I-Donnie Davenport Donnie Davenport: R 1/23/2015 018968 212 0000.127101.00 Seized Funds Payable Donnie Davenport: 19,520.00 19,520.00 1 GABTO I-GABTO 2015 GABTO: R 1/23/2015 018969 100 1511.523600.00 Dues & Fees GABTO: 35.00 35.00 1 Atlanta Weimaraner Club Rescu I-Howl-O-Weim Atlanta Weimaraner Club Rescu: R 1/23/2015 018970 100 0000.127103.00 Special Event Sign Dep PayableAtlanta Weimaraner C 100.00 100.00 1 Jim Riticher I-Jim Riticher Jim Riticher: R 1/23/2015 018971 100 1110.523500.00 Travel Jim Riticher: 991.06 991.06 1 John Heneghan I-John Heneghan (2) John Heneghan: R 1/23/2015 018972 100 1110.531100.00 Supplies John Heneghan: 208.63 100 1110.523600.00 Dues & Fees John Heneghan: 197.65 100 1110.521300.00 Technical Services John Heneghan: 198.99 100 1110.523200.00 Communications John Heneghan: 271.33 876.60
SLIDE 48
4/21/2015 10:29 AM A/P HISTORY CHECK REPORT PAGE: 22 VENDOR SET: 01 City of Dunwoody, GA BANK: 03 Suntrust Disbursement Acc DATE RANGE: 1/01/2015 THRU 3/31/2015 CHECK CHECK CHECK CHECK VENDOR I.D. NAME STATUS DATE AMOUNT DISCOUNT NO STATUS AMOUNT 1 MJ Murphy Counseling Svcs I-MJ Murphy MJ Murphy Counseling Svcs: R 1/23/2015 018973 100 0000.316100.00 Business & Occupation Tax MJ Murphy Counseling 31.20 31.20 1 Melanie Antos I-Melanie Antos (3) Melanie Antos: R 1/23/2015 018974 100 0000.127103.00 Special Event Sign Dep PayableMelanie Antos: 100.00 100.00 1 Michael Smith I-Michael Smith (2) Michael Smith: R 1/23/2015 018975 100 4100.523500.00 Travel Michael Smith: 475.13 475.13 1 R. Adam Malone I-R. Adam Malone R. Adam Malone: R 1/23/2015 018976 100 0000.316100.00 Business & Occupation Tax R. Adam Malone: 181.00 181.00 1 Rebecca Keefer I-Rebecca Keefer (4) Rebecca Keefer: R 1/23/2015 018977 100 7000.531300.00 Food Rebecca Keefer: 27.99 27.99 1 Sara Tabor I-Sara Tabor (4) Sara Tabor: R 1/23/2015 018978 100 0000.347900.00 Pavilion Rentals Sara Tabor: 200.00 200.00 001274 Nova Engineering and Environme I-98770 DVP CONST MATERIALS TEST R 1/23/2015 018979 350 4200.541400.00 Infrastructure DVP CONST MATERIALS 6,455.00 6,455.00 001836 Allan Vigil Ford-Lincoln Gover I-12397 Allan Vigil Ford-Lincoln Gover R 1/23/2015 018980 350 3200.542000.00 Machinery & Equipment 2015 Ford Explorer 29,014.00 29,014.00 1 Snipercraft I-Gilbert Snipercraft: R 1/29/2015 018981 100 3200.523700.00 Education & Training Snipercraft: 46.00 46.00 000007 Crier Newspapers I-45132 Crier Newspapers R 2/06/2015 019034 100 1330.523300.00 Advertising Crier Newspapers 457.00 457.00 000008 CIT Technology Fin Serv Inc I-26389649 CIT Technology Fin Serv Inc R 2/06/2015 019035 100 1565.522300.00 Rentals CIT Technology Fin S 733.00 733.00
SLIDE 49
4/21/2015 10:29 AM A/P HISTORY CHECK REPORT PAGE: 23 VENDOR SET: 01 City of Dunwoody, GA BANK: 03 Suntrust Disbursement Acc DATE RANGE: 1/01/2015 THRU 3/31/2015 CHECK CHECK CHECK CHECK VENDOR I.D. NAME STATUS DATE AMOUNT DISCOUNT NO STATUS AMOUNT 000021 Employment Screening Services I-230681 Employment Screening Services R 2/06/2015 019036 100 1540.521300.00 Technical Services Employment Screening 24.00 24.00 000074 Standard Insurance I-February 2015 Standard Insurance R 2/06/2015 019037 100 1330.512100.00 Group Insurance Standard Insurance 106.99 100 1511.512100.00 Group Insurance Standard Insurance 162.68 100 4100.512100.00 Group Insurance Standard Insurance 136.34 100 2650.512100.00 Group Insurance Standard Insurance 254.11 100 3200.512100.00 Group Insurance Standard Insurance 4,294.48 4,954.60 000087 DeKalb Municipal Association I-DMADue 2015 DeKalb Municipal Association R 2/06/2015 019038 100 1511.523600.00 Dues & Fees DeKalb Municipal Ass 47,224.00 47,224.00 000130 Translation Station, INC I-47569 Translation Station, INC R 2/06/2015 019039 100 2650.521300.00 Technical Svcs Translation Station, 356.23 I-47586 Translation Station, INC R 2/06/2015 019039 100 2650.521300.00 Technical Svcs Translation Station, 176.68 532.91 000149 AT&T I-February 2015 AT&T R 2/06/2015 019040 100 1535.523200.00 Communications AT&T 124.33 124.33 000156 Powell, Hugh R I-1991 Powell, Hugh R R 2/06/2015 019041 100 2650.521200.00 Prof Svcs Powell, Hugh R 900.00 900.00 000158 Benefits Law Group I-30390 Benefits Law Group R 2/06/2015 019042 100 1540.521200.00 Professional Services Benefits Law Group 386.38 386.38 000163 Metro Materials Inc. I-38061 Metro Materials Inc. R 2/06/2015 019043 100 4200.531100.00 Supplies Metro Materials Inc. 205.85 205.85 000165 Vulcan Materials Company I-21212013737 Vulcan Materials Company R 2/06/2015 019044 100 4100.531100.00 Supplies Vulcan Materials Com 480.00 480.00 000196 Georgia Management Agency, Inc I-58962 Georgia Management Agency, Inc R 2/06/2015 019045 100 4200.522200.02 R&M - Street Maintenance Georgia Management A 2,614.76 2,614.76
SLIDE 50
4/21/2015 10:29 AM A/P HISTORY CHECK REPORT PAGE: 24 VENDOR SET: 01 City of Dunwoody, GA BANK: 03 Suntrust Disbursement Acc DATE RANGE: 1/01/2015 THRU 3/31/2015 CHECK CHECK CHECK CHECK VENDOR I.D. NAME STATUS DATE AMOUNT DISCOUNT NO STATUS AMOUNT 000206 Georgia Power I-09153-15043/Jan 15 Georgia Power R 2/06/2015 019046 100 6200.531230.00 Utilities Georgia Power 27.28 27.28 000206 Georgia Power I-26354-99019/Jan 15 Georgia Power R 2/06/2015 019047 100 6200.531230.00 Utilities Georgia Power 3.27 3.27 000206 Georgia Power I-January 2015 Georgia Power R 2/06/2015 019048 100 4100.531230.00 Electricity Georgia Power 37,423.51 100 6200.531230.00 Utilities Georgia Power 7,770.29 45,193.80 000210 Rotary Club of Dunwoody, GA In I-3239 Rotary Club of Dunwoody, GA In R 2/06/2015 019049 100 3200.523600.00 Dues & Fees Rotary Club of Dunwo 437.50 I-3264 Rotary Club of Dunwoody, GA In R 2/06/2015 019049 100 1110.523600.00 Dues & Fees Rotary Club of Dunwo 437.50 875.00 000269 DeKalb County Georgia I-6305611-Jan 15 DeKalb County Georgia R 2/06/2015 019050 100 6200.531230.00 Utilities DeKalb County Georgi 136.37 I-6305655-1/18/15 DeKalb County Georgia R 2/06/2015 019050 100 6200.531230.00 Utilities DeKalb County Georgi 150.07 I-6305677-1/18/15 DeKalb County Georgia R 2/06/2015 019050 100 6200.531230.00 Utilities DeKalb County Georgi 416.61 I-6305688-1/18/15 DeKalb County Georgia R 2/06/2015 019050 100 6200.531230.00 Utilities DeKalb County Georgi 48.35 I-6563314-1/13/15 DeKalb County Georgia R 2/06/2015 019050 100 6200.531230.00 Utilities DeKalb County Georgi 9.50 760.90 000331 Tyler Technologies, Inc I-025-114798 Tyler Technologies, Inc R 2/06/2015 019051 100 2650.522200.00 Repairs & Maintenance Tyler Technologies, 200.00 200.00 001107 TerraMark I-T2014-138-8042 TerraMark R 2/06/2015 019052 560 4320.521200.09 Prof Svcs-Stormwater TerraMark 5,380.00 5,380.00 001170 Hasley Recreation, Inc. I-14-473 Hasley Recreation, Inc. R 2/06/2015 019053 100 6200.531100.00 Supplies Hasley Recreation, I 20,103.00 20,103.00
SLIDE 51
4/21/2015 10:29 AM A/P HISTORY CHECK REPORT PAGE: 25 VENDOR SET: 01 City of Dunwoody, GA BANK: 03 Suntrust Disbursement Acc DATE RANGE: 1/01/2015 THRU 3/31/2015 CHECK CHECK CHECK CHECK VENDOR I.D. NAME STATUS DATE AMOUNT DISCOUNT NO STATUS AMOUNT 001187 APG PCE, LLC I-PC41-100/Jan 15 APG PCE, LLC R 2/06/2015 019054 100 1565.531230.00 Electricity APG PCE, LLC 2,754.78 2,754.78 001221 CSU Command College I-Barnes-Fiscal Mgmt CSU Command College R 2/06/2015 019055 100 3200.523700.00 Education & Training CSU Command College 950.00 950.00 001275 LMI Systems, Inc I-1048571 LMI Systems, Inc R 2/06/2015 019056 100 6200.522200.06 R&M-Parks LMI Systems, Inc 718.68 I-1049204 LMI Systems, Inc R 2/06/2015 019056 100 6200.522200.06 R&M-Parks LMI Systems, Inc 6,849.67 I-1049272 LMI Systems, Inc R 2/06/2015 019056 100 6200.522200.06 R&M-Parks LMI Systems, Inc 1,275.82 I-1049281 LMI Systems, Inc R 2/06/2015 019056 100 6200.522200.06 R&M-Parks LMI Systems, Inc 4,440.97 I-1050394 LMI Systems, Inc R 2/06/2015 019056 100 6200.522200.06 R&M-Parks LMI Systems, Inc 501.88 I-1050491 LMI Systems, Inc R 2/06/2015 019056 100 6200.522200.06 R&M-Parks LMI Systems, Inc 563.31 14,350.33 001281 Phase 3 Marketing & Communicat I-0075560-IN Phase 3 Marketing & Communicat R 2/06/2015 019057 100 7500.523300.00 Advertising Phase 3 Marketing & 5,000.00 5,000.00 001333 E. Harriman Construction, Inc. I-0128-15 E. Harriman Construction, Inc. R 2/06/2015 019058 100 6200.522200.06 R&M-Parks E. Harriman Construc 49,596.00 49,596.00 001415 Rite Way I-366986 Rite Way R 2/06/2015 019059 100 6200.522200.06 R&M-Parks Rite Way 1,621.32 1,621.32 001426 A&A Plumbing I-493 A&A Plumbing R 2/06/2015 019060 100 6200.522200.06 R&M-Parks A&A Plumbing 6,035.00 6,035.00 001444 Kenneth Wickham I-1/21/2015 Kenneth Wickham R 2/06/2015 019061 100 2650.521200.00 Prof Svcs Kenneth Wickham 400.00 400.00 001477 Gresham, Smith and Partners I-27 Gresham, Smith and Partners R 2/06/2015 019062 350 4200.541400.00 Infrastructure Gresham, Smith and P 3,959.52 3,959.52
SLIDE 52
4/21/2015 10:29 AM A/P HISTORY CHECK REPORT PAGE: 26 VENDOR SET: 01 City of Dunwoody, GA BANK: 03 Suntrust Disbursement Acc DATE RANGE: 1/01/2015 THRU 3/31/2015 CHECK CHECK CHECK CHECK VENDOR I.D. NAME STATUS DATE AMOUNT DISCOUNT NO STATUS AMOUNT 001484 URS Corporation I-6154843 URS Corporation R 2/06/2015 019063 250 4002.541400.14 TAP-Infrastructure URS Corporation 27,091.05 27,091.05 001508 Atlanta Business Chronicle I-16543 Atlanta Business Chronicle R 2/06/2015 019064 100 1570.523300.00 Advertising Atlanta Business Chr 6,450.00 6,450.00 001517 Southern Premier Contractors, I-201501272727 Barcroft Way Box Culvert R 2/06/2015 019065 560 4320.522200.00 Repairs & Maintenance Barcroft Way Box Cul 8,666.35 8,666.35 001528 GRT Systems Inc dba N American I-108646 GRT Systems Inc dba N American R 2/06/2015 019066 100 6200.522200.06 R&M-Parks GRT Systems Inc dba 556.90 556.90 001549 Gas South, LLC I-January 2015 Gas South, LLC R 2/06/2015 019067 100 6200.531230.00 Utilities Gas South, LLC 1,182.21 1,182.21 001565 Georgia Development Partners, I-121914 Georgia Development Partners, R 2/06/2015 019068 350 4200.541400.00 Infrastructure Georgia Development 5,750.00 5,750.00 001656 De Lage Landen I-44306175 De Lage Landen R 2/06/2015 019069 100 3200.522300.00 Rentals De Lage Landen 304.00 304.00 001673 Aerial Innovations of Ga., Inc I-45109 Aerial Innovations of Ga., Inc R 2/06/2015 019070 100 7000.521300.00 Technical Svcs Aerial Innovations o 91.50 I-45110 Aerial Innovations of Ga., Inc R 2/06/2015 019070 100 7000.521300.00 Technical Svcs Aerial Innovations o 94.50 186.00 001713 Dunwoody Nature Center I-2015-1-27 Dunwoody Nature Center R 2/06/2015 019072 100 1570.523300.00 Advertising Dunwoody Nature Cent 3,000.00 3,000.00 001795 ABM Janitorial Services - Sout I-7544048 ABM Janitorial Services - Sout R 2/06/2015 019073 100 3200.522200.00 Repairs & Maintenance ABM Janitorial Servi 335.00 I-7544049 ABM Janitorial Services - Sout R 2/06/2015 019073 100 1565.522200.00 Repairs & Maintenance ABM Janitorial Servi 325.00 660.00
SLIDE 53
4/21/2015 10:29 AM A/P HISTORY CHECK REPORT PAGE: 27 VENDOR SET: 01 City of Dunwoody, GA BANK: 03 Suntrust Disbursement Acc DATE RANGE: 1/01/2015 THRU 3/31/2015 CHECK CHECK CHECK CHECK VENDOR I.D. NAME STATUS DATE AMOUNT DISCOUNT NO STATUS AMOUNT 001810 Slavin Management Consultants I-SMC1215.119 Slavin Management Consultants R 2/06/2015 019074 100 1320.521200.00 Prof Svcs Slavin Management Co 2,260.70 2,260.70 001820 Sharon Dickson, LLC I-1/30/2015 Sharon Dickson, LLC R 2/06/2015 019075 100 2650.521200.00 Prof Svcs Sharon Dickson, LLC 800.00 800.00 001825 Randstad US LP I-R17222127 Randstad US LP R 2/06/2015 019076 100 7000.522200.00 Repairs & Maintenance Randstad US LP 522.74 I-R17254365 Randstad US LP R 2/06/2015 019076 100 7000.522200.00 Repairs & Maintenance Randstad US LP 419.31 942.05 001831 CDI-Infrastructure, LLC dba L. I-526152 (2) CDI-Infrastructure, LLC dba L. R 2/06/2015 019077 215 3800.523200.00 Communications CDI-Infrastructure, 1,406.00 I-528273 CDI-Infrastructure, LLC dba L. R 2/06/2015 019077 215 3800.523200.00 Communications CDI-Infrastructure, 296.00 1,702.00 001833 Marny Heit I-Anne Hubbard Marny Heit R 2/06/2015 019078 100 2650.521200.04 Prof Svcs-Public Defender Marny Heit 170.00 I-Jacqueline Chandle Marny Heit R 2/06/2015 019078 100 2650.521200.04 Prof Svcs-Public Defender Marny Heit 120.00 I-Tianna Moses Marny Heit R 2/06/2015 019078 100 2650.521200.04 Prof Svcs-Public Defender Marny Heit 170.00 460.00 001837 Moonshowers, Inc I-2102 Moonshowers, Inc R 2/06/2015 019079 560 4320.522200.00 Repairs & Maintenance Moonshowers, Inc 3,750.00 3,750.00 001838 Sustainable Water Planning & E I-1009 Sustainable Water Planning & E R 2/06/2015 019080 560 4320.522200.00 Repairs & Maintenance Sustainable Water Pl 910.00 I-1010 Sustainable Water Planning & E R 2/06/2015 019080 560 4320.521200.09 Prof Svcs-Stormwater Sustainable Water Pl 4,900.00 5,810.00 001866 Barclay-Peachford Property Own I-1671 Barclay-Peachford Property Own R 2/06/2015 019081 350 4200.541400.00 Infrastructure Barclay-Peachford Pr 3,250.00 3,250.00 001868 American Heritage Life Insuran I-19795 (Jan 2015) American Heritage Life Insuran R 2/06/2015 019082 100 0000.121300.18 AFLAC Deductions Payable American Heritage Li 1,920.28 1,920.28
SLIDE 54
4/21/2015 10:29 AM A/P HISTORY CHECK REPORT PAGE: 28 VENDOR SET: 01 City of Dunwoody, GA BANK: 03 Suntrust Disbursement Acc DATE RANGE: 1/01/2015 THRU 3/31/2015 CHECK CHECK CHECK CHECK VENDOR I.D. NAME STATUS DATE AMOUNT DISCOUNT NO STATUS AMOUNT 001869 Site Solutions, LLC I-2010606 Site Solutions, LLC R 2/06/2015 019083 100 7000.521300.00 Technical Svcs Site Solutions, LLC 7,500.00 7,500.00 1 John Heneghan I-John Heneghan (3) John Heneghan: R 2/06/2015 019084 100 1110.531100.00 Supplies John Heneghan: 97.99 97.99 1 Wild Wing Cafe I-Wild Wing Cafe Wild Wing Cafe: R 2/06/2015 019085 100 0000.316100.00 Business & Occupation Tax Wild Wing Cafe: 8.20 8.20 001871 EEP Events, LLC I-1061241 EEP Events, LLC R 2/10/2015 019086 100 0000.115300.01 State of the City EEP Events, LLC 2,340.00 2,340.00 000061 Blue Cross Blue Shield I-000563349G Blue Cross Blue Shield R 2/20/2015 019087 100 1110.512100.00 Group Insurance Blue Cross Blue Shie 3,686.01 100 1320.512100.00 Group Insurance Blue Cross Blue Shie 1,560.65 100 1330.512100.00 Group Insurance Blue Cross Blue Shie 1,074.54 100 1511.512100.00 Group Insurance Blue Cross Blue Shie 1,560.65 100 2650.512100.00 Group Insurance Blue Cross Blue Shie 2,074.19 100 3200.512100.00 Group Insurance Blue Cross Blue Shie 63,506.28 100 4100.512100.00 Group Insurance Blue Cross Blue Shie 1,560.65 75,022.97 000102 GFOA I-2781533 GFOA R 2/20/2015 019088 100 1513.521200.00 Professional Services GFOA 330.00 330.00 000118 Peace Officers' I-February 2015 Peace Officers' R 2/20/2015 019089 100 0000.121300.15 POAB Deduction Payable Peace Officers' 660.00 660.00 000129 Verizon Wireless Services LLC I-9738850797 Verizon Wireless Services LLC R 2/20/2015 019090 100 1110.523200.00 Communications Verizon Wireless Ser 60.94 100 1110.523200.00 Communications Verizon Wireless Ser 38.01 100 1320.523200.00 Communications Verizon Wireless Ser 136.71 100 1330.523200.00 Communications Verizon Wireless Ser 91.46 100 1511.523200.00 Communications Verizon Wireless Ser 97.18 100 2650.523200.00 Communications Verizon Wireless Ser 60.69 100 3200.523200.00 Communications Verizon Wireless Ser 6,033.32 100 4100.523200.00 Communications Verizon Wireless Ser 98.70 100 6200.523200.00 Communications Verizon Wireless Ser 38.01 6,655.02
SLIDE 55
4/21/2015 10:29 AM A/P HISTORY CHECK REPORT PAGE: 29 VENDOR SET: 01 City of Dunwoody, GA BANK: 03 Suntrust Disbursement Acc DATE RANGE: 1/01/2015 THRU 3/31/2015 CHECK CHECK CHECK CHECK VENDOR I.D. NAME STATUS DATE AMOUNT DISCOUNT NO STATUS AMOUNT 000130 Translation Station, INC I-47935 Translation Station, INC R 2/20/2015 019091 100 2650.521300.00 Technical Svcs Translation Station, 166.90 166.90 000138 Riley McLendon, LLC I-62632 Riley McLendon, LLC R 2/20/2015 019092 100 1530.521200.01 Prof Svcs-Legal Riley McLendon, LLC 12,500.00 I-62633 Riley McLendon, LLC R 2/20/2015 019092 100 1530.521200.02 Prof Svcs-Litigation Riley McLendon, LLC 2,840.50 I-62634 Riley McLendon, LLC R 2/20/2015 019092 100 2650.521200.03 Prof Svcs-Court Solicitor Riley McLendon, LLC 7,020.00 I-62635 Riley McLendon, LLC R 2/20/2015 019092 350 4200.541400.00 Infrastructure Riley McLendon, LLC 72.00 22,432.50 000149 AT&T I-Feb 2015 AT&T R 2/20/2015 019093 100 1535.523200.00 Communications AT&T 118.02 118.02 000150 Fidelity Security Life Insuran I-59606 Fidelity Security Life Insuran R 2/20/2015 019094 100 0000.121300.12 EE-Vision Payable Fidelity Security Li 442.86 442.86 000151 Wolfe, Timothy W. I-January 2015 Wolfe, Timothy W. R 2/20/2015 019095 100 2650.521200.00 Prof Svcs Wolfe, Timothy W. 800.00 800.00 000160 Georgia Technology Authority I-924-660880115 Georgia Technology Authority R 2/20/2015 019096 100 3200.521300.00 Technical Svcs Georgia Technology A 39.41 39.41 000163 Metro Materials Inc. I-38209 Metro Materials Inc. R 2/20/2015 019097 100 4200.531100.00 Supplies Metro Materials Inc. 264.40 I-38284 Metro Materials Inc. R 2/20/2015 019097 100 4200.531100.00 Supplies Metro Materials Inc. 319.79 584.19 000165 Vulcan Materials Company I-11108903 Vulcan Materials Company R 2/20/2015 019098 100 4200.531100.00 Supplies Vulcan Materials Com 5,192.13 I-11119728 Vulcan Materials Company R 2/20/2015 019098 560 4320.531100.00 Supplies Vulcan Materials Com 1,779.94 I-21212014477 Vulcan Materials Company R 2/20/2015 019098 560 4320.531100.00 Supplies Vulcan Materials Com 519.00 I-21212014691 Vulcan Materials Company R 2/20/2015 019098 560 4320.531100.00 Supplies Vulcan Materials Com 602.50 8,093.57
SLIDE 56
4/21/2015 10:29 AM A/P HISTORY CHECK REPORT PAGE: 30 VENDOR SET: 01 City of Dunwoody, GA BANK: 03 Suntrust Disbursement Acc DATE RANGE: 1/01/2015 THRU 3/31/2015 CHECK CHECK CHECK CHECK VENDOR I.D. NAME STATUS DATE AMOUNT DISCOUNT NO STATUS AMOUNT 000196 Georgia Management Agency, Inc I-58973 Georgia Management Agency, Inc R 2/20/2015 019099 100 4200.522200.03 R&M - Traffic Signals Georgia Management A 12,579.50 100 4200.522200.02 R&M - Street Maintenance Georgia Management A 3,887.10 16,466.60 000206 Georgia Power I-24953-72008/Jan15 Georgia Power R 2/20/2015 019100 100 6200.531230.00 Utilities Georgia Power 474.85 474.85 000249 Municipal Code Corporation I-00251854 Municipal Code Corporation R 2/20/2015 019101 100 1330.521200.00 Prof Svcs Municipal Code Corpo 1,767.32 1,767.32 000262 Dunwoody Chamber of Commerce I I-6303 Dunwoody Chamber of Commerce I R 2/20/2015 019102 100 7500.523300.00 Advertising Dunwoody Chamber of 200.00 I-6415 Dunwoody Chamber of Commerce I R 2/20/2015 019102 100 7500.523300.00 Advertising Dunwoody Chamber of 240.00 440.00 000269 DeKalb County Georgia I-5986738/Dec 2014 DeKalb County Georgia R 2/20/2015 019103 100 6200.531230.00 Utilities DeKalb County Georgi 5.71 I-6178709/Dec 2014 DeKalb County Georgia R 2/20/2015 019103 100 6200.531230.00 Utilities DeKalb County Georgi 48.53 I-6305611/Dec 2014 DeKalb County Georgia R 2/20/2015 019103 100 6200.531230.00 Utilities DeKalb County Georgi 123.39 I-6305655/Dec 2014 DeKalb County Georgia R 2/20/2015 019103 100 6200.531230.00 Utilities DeKalb County Georgi 148.03 I-6305677/Dec 2014 DeKalb County Georgia R 2/20/2015 019103 100 6200.531230.00 Utilities DeKalb County Georgi 571.38 I-6305688/Dec 2014 DeKalb County Georgia R 2/20/2015 019103 100 6200.531230.00 Utilities DeKalb County Georgi 49.88 946.92 000331 Tyler Technologies, Inc I-025-114322 Tyler Technologies, Inc R 2/20/2015 019104 100 2650.522200.00 Repairs & Maintenance Tyler Technologies, 80.00 80.00 001009 Kimley-Horn and Associates, In I-019124000-1214 Kimley-Horn and Associates, In R 2/20/2015 019105 350 4200.521200.00 Professional Services Kimley-Horn and Asso 4,055.34 4,055.34 001023 Victoria Clearfield I-January 2015 Victoria Clearfield R 2/20/2015 019106 100 2650.521300.00 Technical Svcs Victoria Clearfield 1,140.00 1,140.00
SLIDE 57
4/21/2015 10:29 AM A/P HISTORY CHECK REPORT PAGE: 31 VENDOR SET: 01 City of Dunwoody, GA BANK: 03 Suntrust Disbursement Acc DATE RANGE: 1/01/2015 THRU 3/31/2015 CHECK CHECK CHECK CHECK VENDOR I.D. NAME STATUS DATE AMOUNT DISCOUNT NO STATUS AMOUNT 001026 Guardian - Appleton I-March 2015 Guardian - Appleton R 2/20/2015 019107 100 1110.512100.00 Group Insurance Guardian - Appleton 296.40 100 1320.512100.00 Group Insurance Guardian - Appleton 131.09 100 1330.512100.00 Group Insurance Guardian - Appleton 71.67 100 1511.512100.00 Group Insurance Guardian - Appleton 131.09 100 2650.512100.00 Group Insurance Guardian - Appleton 162.10 100 3200.512100.00 Group Insurance Guardian - Appleton 4,869.30 100 4100.512100.00 Group Insurance Guardian - Appleton 131.09 5,792.74 001027 Traffic Data Collection, Inc I-15701-01 Traffic Data Collection, Inc R 2/20/2015 019108 100 4100.521200.00 Prof Svcs Traffic Data Collect 119.00 119.00 001037 Mauldin & Jenkins, LLC I-566140 Mauldin & Jenkins, LLC R 2/20/2015 019109 100 1512.521200.00 Professional Services Mauldin & Jenkins, 1,500.00 1,500.00 001086 Schiff Hardin LLP I-1972917 Schiff Hardin LLP R 2/20/2015 019110 100 1530.521200.02 Prof Svcs-Litigation Schiff Hardin LLP 17,612.41 17,612.41 001097 US Department of Homeland Secu I-SAVE-343889 US Department of Homeland Secu R 2/20/2015 019111 100 1516.521300.00 Technical Services US Department of Hom 25.00 25.00 001187 APG PCE, LLC I-PC41-100/March2015 APG PCE, LLC R 2/20/2015 019112 100 0000.123310.00 Abated Rent APG PCE, LLC 42,754.13 42,754.13 001275 LMI Systems, Inc I-1050817 LMI Systems, Inc R 2/20/2015 019113 100 6200.522200.06 R&M-Parks LMI Systems, Inc 793.63 I-1050818 LMI Systems, Inc R 2/20/2015 019113 100 6200.522200.06 R&M-Parks LMI Systems, Inc 918.87 I-1050976 LMI Systems, Inc R 2/20/2015 019113 100 6200.522200.06 R&M-Parks LMI Systems, Inc 1,633.60 I-1050977 LMI Systems, Inc R 2/20/2015 019113 100 6200.522200.06 R&M-Parks LMI Systems, Inc 351.75 3,697.85 001277 Allied Paving Contractors, Inc I-6648 Allied Paving Contractors, Inc R 2/20/2015 019114 350 4200.522200.00 Repairs & Maintenance Allied Paving Contra 33,941.24 33,941.24
SLIDE 58
4/21/2015 10:29 AM A/P HISTORY CHECK REPORT PAGE: 32 VENDOR SET: 01 City of Dunwoody, GA BANK: 03 Suntrust Disbursement Acc DATE RANGE: 1/01/2015 THRU 3/31/2015 CHECK CHECK CHECK CHECK VENDOR I.D. NAME STATUS DATE AMOUNT DISCOUNT NO STATUS AMOUNT 001282 United Maintenance, Inc. I-222347 United Maintenance, Inc. R 2/20/2015 019115 100 6200.522200.06 R&M-Parks United Maintenance, 3,065.00 3,065.00 001316 Lose and Associates I-20150121 Lose and Associates R 2/20/2015 019116 350 6200.521200.00 Professional Services Lose and Associates 3,003.00 I-20150160 Lose and Associates R 2/20/2015 019116 350 6200.521200.00 Professional Services Lose and Associates 1,087.50 4,090.50 001328 LexisNexis Risk Data Managemen I-1502895-20150131 LexisNexis Risk Data Managemen R 2/20/2015 019117 100 1511.521300.00 Technical Services LexisNexis Risk Data 50.00 50.00 001333 E. Harriman Construction, Inc. I-0202-15 E. Harriman Construction, Inc. R 2/20/2015 019118 350 6200.521200.00 Professional Services E. Harriman Construc 35,640.00 35,640.00 001345 JEL Consulting Group, LLC I-216 JEL Consulting Group, LLC R 2/20/2015 019119 100 7500.521200.00 Professional Services JEL Consulting Group 2,500.00 2,500.00 001385 Wolverton and Associates, Inc. I-40145 Wolverton and Associates, Inc. R 2/20/2015 019120 350 4200.541400.00 Infrastructure Wolverton and Associ 649.01 649.01 001429 Hardy Chevrolet I-117621 Hardy Chevrolet R 2/20/2015 019121 350 3200.542000.00 Machinery & Equipment Hardy Chevrolet 29,005.00 29,005.00 001430 John Deere Landscapes, Inc I-70540268 John Deere Landscapes, Inc R 2/20/2015 019122 100 4200.522200.05 R&M - Right of Way Maint John Deere Landscape 697.00 I-70544158 John Deere Landscapes, Inc R 2/20/2015 019122 100 4200.522200.05 R&M - Right of Way Maint John Deere Landscape 299.00 996.00 001434 Michael M. Hawkins I-January 2015 Michael M. Hawkins R 2/20/2015 019123 100 2650.521200.00 Prof Svcs Michael M. Hawkins 800.00 800.00 001444 Kenneth Wickham I-2/4/2015 Kenneth Wickham R 2/20/2015 019124 100 2650.521200.00 Prof Svcs Kenneth Wickham 400.00 400.00
SLIDE 59
4/21/2015 10:29 AM A/P HISTORY CHECK REPORT PAGE: 33 VENDOR SET: 01 City of Dunwoody, GA BANK: 03 Suntrust Disbursement Acc DATE RANGE: 1/01/2015 THRU 3/31/2015 CHECK CHECK CHECK CHECK VENDOR I.D. NAME STATUS DATE AMOUNT DISCOUNT NO STATUS AMOUNT 001477 Gresham, Smith and Partners I-28 Gresham, Smith and Partners R 2/20/2015 019125 350 4200.541400.00 Infrastructure Gresham, Smith and P 6,234.58 6,234.58 001493 Entek I-26956 Entek R 2/20/2015 019126 100 1565.522200.00 Repairs & Maintenance Entek 619.00 619.00 001504 American Engineers, Inc I-94930 American Engineers, Inc R 2/20/2015 019127 350 4200.541400.00 Infrastructure American Engineers, 1,750.00 1,750.00 001528 GRT Systems Inc dba N American I-108740 GRT Systems Inc dba N American R 2/20/2015 019128 100 6200.522200.06 R&M-Parks GRT Systems Inc dba 547.80 I-108743 GRT Systems Inc dba N American R 2/20/2015 019128 100 6200.522200.06 R&M-Parks GRT Systems Inc dba 786.60 1,334.40 001587 SouthernLINC Wireless I-3941 SouthernLINC Wireless R 2/20/2015 019129 215 3800.523200.00 Communications SouthernLINC Wireles 1.35 1.35 001654 Eyesome Productions LLC I-2015 State of City Eyesome Productions LLC R 2/20/2015 019130 100 1570.521200.00 Professional Services Eyesome Productions 2,275.00 2,275.00 001673 Aerial Innovations of Ga., Inc I-45192 Aerial Innovations of Ga., Inc R 2/20/2015 019131 100 7000.521300.00 Technical Svcs Aerial Innovations o 94.50 I-45193 Aerial Innovations of Ga., Inc R 2/20/2015 019131 100 7000.521300.00 Technical Svcs Aerial Innovations o 91.50 186.00 001692 LogIn/IACP Net I-24832 LogIn/IACP Net R 2/20/2015 019132 100 3200.522200.01 Repairs & Maintenance-SoftwareLogIn/IACP Net 875.00 875.00 001719 Perimeter Community Improvemen I-PCID 12615 (2&3) Perimeter Community Improvemen R 2/20/2015 019133 250 4006.541400.14 Bike Impl Plan-Infrastructure Perimeter Community 15,992.19 15,992.19 001732 AT&T Mobility II LLC I-070155-1014 AT&T Mobility II LLC R 2/20/2015 019134 215 3800.523200.00 Communications AT&T Mobility II LLC 6,670.50 I-070155-1114 AT&T Mobility II LLC R 2/20/2015 019134 215 3800.523200.00 Communications AT&T Mobility II LLC 6,366.90 13,037.40
SLIDE 60
4/21/2015 10:29 AM A/P HISTORY CHECK REPORT PAGE: 34 VENDOR SET: 01 City of Dunwoody, GA BANK: 03 Suntrust Disbursement Acc DATE RANGE: 1/01/2015 THRU 3/31/2015 CHECK CHECK CHECK CHECK VENDOR I.D. NAME STATUS DATE AMOUNT DISCOUNT NO STATUS AMOUNT 001756 Georgia Snacks I-117 Georgia Snacks R 2/20/2015 019135 100 1540.512900.00 Other Employment Benefits Georgia Snacks 800.00 800.00 001799 Colliers International - Atlan I-February 2015 Colliers International - Atlan R 2/20/2015 019137 100 0000.381100.00 Rental Commissions Colliers Internation 362.25 362.25 001801 Creative Impressions, LLC I-1719 Creative Impressions, LLC R 2/20/2015 019138 100 6200.521200.00 Professional Services Creative Impressions 8,473.56 8,473.56 001812 Earth Networks Incorporated db I-WBB0025406 Earth Networks Incorporated db R 2/20/2015 019139 350 6200.542000.00 Machinery & Equipment Earth Networks Incor 25,750.00 25,750.00 001825 Randstad US LP I-R17285959 Randstad US LP R 2/20/2015 019140 100 7000.522200.00 Repairs & Maintenance Randstad US LP 461.54 461.54 001835 Landscape Structures, Inc. I-INV-010408 (2) Landscape Structures, Inc. R 2/20/2015 019141 350 6200.541400.00 Infrastructure Landscape Structures 75,138.15 75,138.15 001841 Ed Castro Landscape, Inc. I-Pay App 3 Ed Castro Landscape, Inc. R 2/20/2015 019142 350 4200.541400.00 Infrastructure Ed Castro Landscape, 107,965.50 107,965.50 001861 EmpowerD Wellness I-February 2015 EmpowerD Wellness R 2/20/2015 019143 100 1540.512900.00 Other Employment Benefits EmpowerD Wellness 1,565.42 1,565.42 001870 Health Point Chiropractic & We I-99784641 Health Point Chiropractic & We R 2/20/2015 019144 100 1540.512900.00 Other Employment Benefits Health Point Chiropr 385.00 385.00 001874 SOS Virtual Assistance I-482 SOS Virtual Assistance R 2/20/2015 019145 100 1517.521300.00 Technical Services SOS Virtual Assistan 172.00 I-489 SOS Virtual Assistance R 2/20/2015 019145 100 1517.521300.00 Technical Services SOS Virtual Assistan 164.00 336.00 1 Carbonara I-Alcohol Excise Tax Carbonara: R 2/20/2015 019146 100 0000.314200.00 Alcoholic Beverage Excise Tax Carbonara: 20,825.52 20,825.52
SLIDE 61
4/21/2015 10:29 AM A/P HISTORY CHECK REPORT PAGE: 35 VENDOR SET: 01 City of Dunwoody, GA BANK: 03 Suntrust Disbursement Acc DATE RANGE: 1/01/2015 THRU 3/31/2015 CHECK CHECK CHECK CHECK VENDOR I.D. NAME STATUS DATE AMOUNT DISCOUNT NO STATUS AMOUNT 1 Crossroads Church of Dunwoody I-Almaz-Heating Crossroads Church of Dunwoody: R 2/20/2015 019147 100 0000.122500.05 Def Rev-DPD Christmas for KidsCrossroads Church of 500.00 500.00 1 Artistic Alteration I-Artistic Alteratio Artistic Alteration: R 2/20/2015 019148 100 3200.531100.01 Supplies-Explorer Program Artistic Alteration: 260.00 260.00 1 Jimmy Johns of Dunwoody I-Bus Lic Tax Jimmy Johns of Dunwoody: R 2/20/2015 019149 100 0000.316100.00 Business & Occupation Tax Jimmy Johns of Dunwo 113.80 113.80 1 Shane's Rib Shack I-Bus Lic Tax 2015 Shane's Rib Shack: R 2/20/2015 019150 100 0000.316100.00 Business & Occupation Tax Shane's Rib Shack: 260.42 260.42 1 Milestone Building Group I-Business Lic 2015 Milestone Building Group: R 2/20/2015 019151 100 0000.316100.00 Business & Occupation Tax Milestone Building G 16.80 16.80 1 Comfort Homes of Georgia LLC I-Business Tax 2015 Comfort Homes of Georgia LLC: R 2/20/2015 019152 100 0000.316100.00 Business & Occupation Tax Comfort Homes of Geo 146.84 146.84 1 Bruce Piefke I-Caffeine & Octane Bruce Piefke: R 2/20/2015 019153 100 0000.127103.00 Special Event Sign Dep PayableBruce Piefke: 100.00 100.00 1 Consigning Women I-Occ Tax Consigning Women: R 2/20/2015 019154 100 0000.316100.00 Business & Occupation Tax Consigning Women: 140.00 140.00 1 Pete Weissman Communications I-Occupation Tax Pete Weissman Communications: R 2/20/2015 019155 100 0000.316100.00 Business & Occupation Tax Pete Weissman Commun 23.30 23.30 1 Marty Whitcomb I-Tarton Trot-Damage Marty Whitcomb: R 2/20/2015 019156 100 0000.321900.01 Other Licenses and permits Marty Whitcomb: 400.00 400.00 1 Marty Whitcomb I-Tarton Trot-Sign Marty Whitcomb: R 2/20/2015 019157 100 0000.127103.00 Special Event Sign Dep PayableMarty Whitcomb: 400.00 400.00
SLIDE 62
4/21/2015 10:29 AM A/P HISTORY CHECK REPORT PAGE: 36 VENDOR SET: 01 City of Dunwoody, GA BANK: 03 Suntrust Disbursement Acc DATE RANGE: 1/01/2015 THRU 3/31/2015 CHECK CHECK CHECK CHECK VENDOR I.D. NAME STATUS DATE AMOUNT DISCOUNT NO STATUS AMOUNT 000008 CIT Technology Fin Serv Inc I-26532460 CIT Technology Fin Serv Inc R 3/06/2015 019158 100 1565.522300.00 Rentals CIT Technology Fin S 733.00 733.00 000022 ADP I-450326516 ADP R 3/06/2015 019159 100 1512.521200.00 Professional Services ADP 750.00 750.00 000074 Standard Insurance I-March 2015 Standard Insurance R 3/06/2015 019160 100 1330.512100.00 Group Insurance Standard Insurance 106.99 100 1511.512100.00 Group Insurance Standard Insurance 162.68 100 2650.512100.00 Group Insurance Standard Insurance 252.11 100 3200.512100.00 Group Insurance Standard Insurance 4,231.34 100 4100.512100.00 Group Insurance Standard Insurance 136.34 4,889.46 000102 GFOA I-300169521/2015 GFOA R 3/06/2015 019161 100 1512.523600.00 Dues & Fees GFOA 250.00 250.00 000129 Verizon Wireless Services LLC I-9740553963 Verizon Wireless Services LLC R 3/06/2015 019162 100 1110.523200.00 Communications Verizon Wireless Ser 60.94 100 1110.523200.00 Communications Verizon Wireless Ser 38.01 100 1320.523200.00 Communications Verizon Wireless Ser 137.21 100 1330.523200.00 Communications Verizon Wireless Ser 93.21 100 1511.523200.00 Communications Verizon Wireless Ser 397.17 100 2650.523200.00 Communications Verizon Wireless Ser 60.69 100 3200.523200.00 Communications Verizon Wireless Ser 6,028.76 100 4100.523200.00 Communications Verizon Wireless Ser 98.70 100 6200.523200.00 Communications Verizon Wireless Ser 38.01 6,952.70 000130 Translation Station, INC I-48182 Translation Station, INC R 3/06/2015 019163 100 2650.521300.00 Technical Svcs Translation Station, 177.83 177.83 000149 AT&T I-Mar 2015 AT&T R 3/06/2015 019164 100 1535.523200.00 Communications AT&T 124.39 124.39 000156 Powell, Hugh R I-1998 Powell, Hugh R R 3/06/2015 019165 100 2650.521200.00 Prof Svcs Powell, Hugh R 900.00 100 2650.523700.00 Education & Training Powell, Hugh R 225.00 1,125.00
SLIDE 63
4/21/2015 10:29 AM A/P HISTORY CHECK REPORT PAGE: 37 VENDOR SET: 01 City of Dunwoody, GA BANK: 03 Suntrust Disbursement Acc DATE RANGE: 1/01/2015 THRU 3/31/2015 CHECK CHECK CHECK CHECK VENDOR I.D. NAME STATUS DATE AMOUNT DISCOUNT NO STATUS AMOUNT 000163 Metro Materials Inc. I-38369 Metro Materials Inc. R 3/06/2015 019166 100 4200.531100.00 Supplies Metro Materials Inc. 1,387.42 1,387.42 000165 Vulcan Materials Company I-11138081 Vulcan Materials Company R 3/06/2015 019167 100 4200.531100.00 Supplies Vulcan Materials Com 274.68 I-21212015196 Vulcan Materials Company R 3/06/2015 019167 560 4320.531100.00 Supplies Vulcan Materials Com 491.25 I-21212015320 Vulcan Materials Company R 3/06/2015 019167 560 4320.531100.00 Supplies Vulcan Materials Com 272.25 1,038.18 000206 Georgia Power I-09153-15043/Feb 15 Georgia Power R 3/06/2015 019168 100 6200.531230.00 Utilities Georgia Power 25.18 25.18 000206 Georgia Power I-15158-51225/Feb 15 Georgia Power R 3/06/2015 019169 100 6200.531230.00 Utilities Georgia Power 53.21 53.21 000206 Georgia Power I-24953-72008/Feb 15 Georgia Power R 3/06/2015 019170 100 6200.531230.00 Utilities Georgia Power 768.21 768.21 000206 Georgia Power I-26354-99019/Feb 15 Georgia Power R 3/06/2015 019171 100 6200.531230.00 Utilities Georgia Power 24.90 24.90 000211 GIRMA I-222012 GIRMA R 3/06/2015 019172 100 3200.523100.01 Claims GIRMA 1,782.57 1,782.57 000211 GIRMA I-222063 GIRMA R 3/06/2015 019173 100 4200.523100.01 Insurance Claims GIRMA 170.82 170.82 000228 Wildcat Striping and Sealing C I-53067 Wildcat Striping and Sealing C R 3/06/2015 019174 100 4200.522200.02 R&M - Street Maintenance Wildcat Striping and 2,150.00 2,150.00 000236 Precision Delta Corporation I-2804 Precision Delta Corporation R 3/06/2015 019175 100 3200.531100.02 Supplies-Firearms Precision Delta Corp 7,369.40 I-2907 Precision Delta Corporation R 3/06/2015 019175 100 3200.531100.02 Supplies-Firearms Precision Delta Corp 1,660.72 9,030.12
SLIDE 64
4/21/2015 10:29 AM A/P HISTORY CHECK REPORT PAGE: 38 VENDOR SET: 01 City of Dunwoody, GA BANK: 03 Suntrust Disbursement Acc DATE RANGE: 1/01/2015 THRU 3/31/2015 CHECK CHECK CHECK CHECK VENDOR I.D. NAME STATUS DATE AMOUNT DISCOUNT NO STATUS AMOUNT 000269 DeKalb County Georgia I-6305611/Feb 2015 DeKalb County Georgia R 3/06/2015 019176 100 6200.531230.00 Utilities DeKalb County Georgi 58.45 I-6305655/Feb 2015 DeKalb County Georgia R 3/06/2015 019176 100 6200.531230.00 Utilities DeKalb County Georgi 57.73 I-6305677/Feb 2015 DeKalb County Georgia R 3/06/2015 019176 100 6200.531230.00 Utilities DeKalb County Georgi 101.79 I-6305688/Feb 2015 DeKalb County Georgia R 3/06/2015 019176 100 6200.531230.00 Utilities DeKalb County Georgi 21.30 I-6563314/Jan 2015 DeKalb County Georgia R 3/06/2015 019176 100 6200.531230.00 Utilities DeKalb County Georgi 82.22 321.49 000296 Cummins Power South I-010-33305 Cummins Power South R 3/06/2015 019177 100 1565.522200.00 Repairs & Maintenance Cummins Power South 726.15 726.15 000331 Tyler Technologies, Inc I-025-117042 Tyler Technologies, Inc R 3/06/2015 019178 100 2650.522200.00 Repairs & Maintenance Tyler Technologies, 200.00 200.00 001009 Kimley-Horn and Associates, In I-6369394 PCP TRAFFIC ANALYSIS R 3/06/2015 019179 350 4200.521200.00 Professional Services PCP TRAFFIC ANALYSIS 784.53 784.53 001023 Victoria Clearfield I-February 2015 Victoria Clearfield R 3/06/2015 019180 100 2650.521300.00 Technical Svcs Victoria Clearfield 1,155.00 1,155.00 001187 APG PCE, LLC I-PC41-100/Mar 2015 APG PCE, LLC R 3/06/2015 019181 100 1565.531230.00 Electricity APG PCE, LLC 2,249.80 2,249.80 001198 Adrian Security Co. I-30032 Adrian Security Co. R 3/06/2015 019182 100 6200.522200.06 R&M-Parks Adrian Security Co. 395.00 395.00 001242 All About Trees, Inc I-11832 All About Trees, Inc R 3/06/2015 019183 100 4100.521200.10 Tree Fund Expenses All About Trees, Inc 875.00 875.00 001274 Nova Engineering and Environme I-0104983 Nova Engineering and Environme R 3/06/2015 019184 350 4200.541400.00 Infrastructure Nova Engineering and 115.00 115.00
SLIDE 65
4/21/2015 10:29 AM A/P HISTORY CHECK REPORT PAGE: 39 VENDOR SET: 01 City of Dunwoody, GA BANK: 03 Suntrust Disbursement Acc DATE RANGE: 1/01/2015 THRU 3/31/2015 CHECK CHECK CHECK CHECK VENDOR I.D. NAME STATUS DATE AMOUNT DISCOUNT NO STATUS AMOUNT 001275 LMI Systems, Inc I-1051225 LMI Systems, Inc R 3/06/2015 019185 100 6200.522200.06 R&M-Parks LMI Systems, Inc 507.05 507.05 001333 E. Harriman Construction, Inc. I-0224-15 E. Harriman Construction, Inc. R 3/06/2015 019186 350 6200.541200.00 Site improvements E. Harriman Construc 31,687.00 31,687.00 001414 Geo-Hydro Engineers, Inc. I-48983 Geo-Hydro Engineers, Inc. R 3/06/2015 019187 350 1565.541300.00 Buildings Geo-Hydro Engineers, 2,520.95 2,520.95 001415 Rite Way I-367835 Rite Way R 3/06/2015 019188 100 6200.522200.06 R&M-Parks Rite Way 1,621.32 1,621.32 001429 Hardy Chevrolet I-117596 Hardy Chevrolet R 3/06/2015 019189 350 3200.542000.00 Machinery & Equipment Hardy Chevrolet 29,005.00 I-117597 Hardy Chevrolet R 3/06/2015 019189 350 3200.542000.00 Machinery & Equipment Hardy Chevrolet 29,005.00 I-117598 Hardy Chevrolet R 3/06/2015 019189 350 3200.542000.00 Machinery & Equipment Hardy Chevrolet 29,005.00 I-117600 Hardy Chevrolet R 3/06/2015 019189 350 3200.542000.00 Machinery & Equipment Hardy Chevrolet 29,005.00 I-117601 Hardy Chevrolet R 3/06/2015 019189 350 3200.542000.00 Machinery & Equipment Hardy Chevrolet 29,005.00 I-117602 Hardy Chevrolet R 3/06/2015 019189 350 3200.542000.00 Machinery & Equipment Hardy Chevrolet 29,005.00 I-117617 Hardy Chevrolet R 3/06/2015 019189 350 3200.542000.00 Machinery & Equipment Hardy Chevrolet 29,005.00 I-117618 Hardy Chevrolet R 3/06/2015 019189 350 3200.542000.00 Machinery & Equipment Hardy Chevrolet 29,005.00 I-117626 Hardy Chevrolet R 3/06/2015 019189 350 3200.542000.00 Machinery & Equipment Hardy Chevrolet 29,005.00 I-117627 Hardy Chevrolet R 3/06/2015 019189 350 3200.542000.00 Machinery & Equipment Hardy Chevrolet 29,005.00 I-119783 Hardy Chevrolet R 3/06/2015 019189 350 3200.542000.00 Machinery & Equipment Hardy Chevrolet 29,005.00 319,055.00 001430 John Deere Landscapes, Inc I-70816747 John Deere Landscapes, Inc R 3/06/2015 019190 100 6200.531100.00 Supplies John Deere Landscape 1,047.00 1,047.00
SLIDE 66
4/21/2015 10:29 AM A/P HISTORY CHECK REPORT PAGE: 40 VENDOR SET: 01 City of Dunwoody, GA BANK: 03 Suntrust Disbursement Acc DATE RANGE: 1/01/2015 THRU 3/31/2015 CHECK CHECK CHECK CHECK VENDOR I.D. NAME STATUS DATE AMOUNT DISCOUNT NO STATUS AMOUNT 001444 Kenneth Wickham I-2/19/2015 Kenneth Wickham R 3/06/2015 019191 100 2650.521200.00 Prof Svcs Kenneth Wickham 400.00 400.00 001504 American Engineers, Inc I-95239 American Engineers, Inc R 3/06/2015 019192 350 4200.541400.00 Infrastructure American Engineers, 6,500.00 6,500.00 001624 Penn-Fence, Inc. I-Deposit 1 Penn-Fence, Inc. R 3/06/2015 019193 100 6200.522200.06 R&M-Parks Penn-Fence, Inc. 916.00 916.00 001645 Hyland Software, Inc. I-265903 Hyland Software, Inc. R 3/06/2015 019194 100 1330.522200.00 Repairs & Maintenance Hyland Software, Inc 12,500.99 12,500.99 001656 De Lage Landen I-44673538 De Lage Landen R 3/06/2015 019195 100 3200.522300.00 Rentals De Lage Landen 304.00 304.00 001673 Aerial Innovations of Ga., Inc I-45292 Aerial Innovations of Ga., Inc R 3/06/2015 019196 100 7000.521300.00 Technical Svcs Aerial Innovations o 94.50 94.50 001690 Oldcastle Precast Inc. I-410128799 Oldcastle Precast Inc. R 3/06/2015 019197 560 4320.531100.00 Supplies Oldcastle Precast In 546.45 546.45 001712 Mulkey, Inc. I-2014066.00-6 Mulkey, Inc. R 3/06/2015 019198 350 4200.541400.00 Infrastructure Mulkey, Inc. 360.00 360.00 001728 Smith Real Estate I-CDR001 ROW SERVICES AT CD R 3/06/2015 019199 350 4200.521200.00 Professional Services ROW SERVICES AT CD 4,250.00 4,250.00 001750 Riley McLendon, LLC II I-18-359-02-015 Riley McLendon, LLC II R 3/06/2015 019200 350 4200.541400.00 Infrastructure Riley McLendon, LLC 10,000.00 I-18-359-02-071 Riley McLendon, LLC II R 3/06/2015 019200 350 4200.541400.00 Infrastructure Riley McLendon, LLC 1,500.00 11,500.00 001763 Uniquely Speaking, Inc. I-2015 Deposit Uniquely Speaking, Inc. R 3/06/2015 019201 100 0000.122500.03 Deferred Rev-Conference Uniquely Speaking, I 5,000.00 5,000.00
SLIDE 67
4/21/2015 10:29 AM A/P HISTORY CHECK REPORT PAGE: 41 VENDOR SET: 01 City of Dunwoody, GA BANK: 03 Suntrust Disbursement Acc DATE RANGE: 1/01/2015 THRU 3/31/2015 CHECK CHECK CHECK CHECK VENDOR I.D. NAME STATUS DATE AMOUNT DISCOUNT NO STATUS AMOUNT 001769 Trace Security I-7567 Trace Security R 3/06/2015 019202 100 1535.521300.00 Technical Services Trace Security 10,000.00 10,000.00 001820 Sharon Dickson, LLC I-February 2015 Sharon Dickson, LLC R 3/06/2015 019203 100 2650.521200.00 Prof Svcs Sharon Dickson, LLC 800.00 100 2650.523700.00 Education & Training Sharon Dickson, LLC 112.50 912.50 001823 Guest Electric Company, LLC I-3667-1 Guest Electric Company, LLC R 3/06/2015 019204 100 1535.522200.00 Repairs & Maintenance Guest Electric Compa 278.00 278.00 001824 Veith Traffic Services, LLC I-3011-9 Veith Traffic Services, LLC R 3/06/2015 019205 100 4200.522200.03 R&M - Traffic Signals Veith Traffic Servic 390.00 390.00 001825 Randstad US LP I-R17350221 Randstad US LP R 3/06/2015 019206 100 7000.522200.00 Repairs & Maintenance Randstad US LP 590.02 I-R17381813 Randstad US LP R 3/06/2015 019206 100 7000.522200.00 Repairs & Maintenance Randstad US LP 366.71 956.73 001852 Ahlberg Engineering, Inc. I-17546 Ahlberg Engineering, Inc. R 3/06/2015 019207 560 4320.522200.00 Repairs & Maintenance Ahlberg Engineering, 285.00 285.00 001868 American Heritage Life Insuran I-19795-Feb 2015 American Heritage Life Insuran R 3/06/2015 019208 100 0000.121300.18 AFLAC Deductions Payable American Heritage Li 1,920.28 1,920.28 001875 American Reprographics Corpora I-370231 American Reprographics Corpora R 3/06/2015 019209 100 0000.115300.01 State of the City American Reprographi 750.00 750.00 001876 ICMA I-109237-796738 ICMA R 3/06/2015 019210 100 1320.521300.00 Technical Services ICMA 450.00 450.00 1 Holder Construction Group I-BLD2015-10178 Holder Construction Group: R 3/06/2015 019211 100 0000.323100.00 Bldg Structures & Equipment Holder Construction 50.00 50.00
SLIDE 68
4/21/2015 10:29 AM A/P HISTORY CHECK REPORT PAGE: 42 VENDOR SET: 01 City of Dunwoody, GA BANK: 03 Suntrust Disbursement Acc DATE RANGE: 1/01/2015 THRU 3/31/2015 CHECK CHECK CHECK CHECK VENDOR I.D. NAME STATUS DATE AMOUNT DISCOUNT NO STATUS AMOUNT 1 Boos Development Group I-Cash Bond Boos Development Group: R 3/06/2015 019212 100 0000.127102.00 Bonding Escrows Payable Boos Development Gro 3,600.00 3,600.00 1 Tide Dunwoody I-Dunwoody Explorers Tide Dunwoody: R 3/06/2015 019213 100 3200.531100.01 Supplies-Explorer Program Tide Dunwoody: 60.31 60.31 1 Mark Vescio I-Sign Deposit Mark Vescio: R 3/06/2015 019214 100 0000.127103.00 Special Event Sign Dep PayableMark Vescio: 100.00 100.00 1 Michael Starling I-Starling Michael Starling: R 3/06/2015 019215 100 7500.523600.00 Dues & Fees Michael Starling: 900.00 100 7500.531300.00 Food Michael Starling: 70.18 970.18 000206 Georgia Power I-February 2015 Georgia Power R 3/10/2015 019216 100 4100.531230.00 Electricity Georgia Power 37,465.81 100 6200.531230.00 Utilities Georgia Power 8,654.46 46,120.27 001878 State Farm I-March 2015 State Farm R 3/13/2015 019217 960 6200.523600.00 Dues & Fees State Farm 312.83 312.83 000061 Blue Cross Blue Shield I-000573708G Blue Cross Blue Shield R 3/20/2015 019218 100 1110.512100.00 Group Insurance Blue Cross Blue Shie 3,847.73 100 1320.512100.00 Group Insurance Blue Cross Blue Shie 1,560.65 100 1330.512100.00 Group Insurance Blue Cross Blue Shie 1,074.54 100 1511.512100.00 Group Insurance Blue Cross Blue Shie 1,560.65 100 2650.512100.00 Group Insurance Blue Cross Blue Shie 2,074.19 100 3200.512100.00 Group Insurance Blue Cross Blue Shie 63,228.78 100 4100.512100.00 Group Insurance Blue Cross Blue Shie 1,560.65 74,907.19 000081 Dekalb County Chief's Associat I-DCCA Annual Dues Dekalb County Chief's Associat R 3/20/2015 019219 100 3200.523600.00 Dues & Fees Dekalb County Chief' 50.00 50.00 000118 Peace Officers' I-March 2015 Peace Officers' R 3/20/2015 019220 100 0000.121300.15 POAB Deduction Payable Peace Officers' 660.00 660.00
SLIDE 69
4/21/2015 10:29 AM A/P HISTORY CHECK REPORT PAGE: 43 VENDOR SET: 01 City of Dunwoody, GA BANK: 03 Suntrust Disbursement Acc DATE RANGE: 1/01/2015 THRU 3/31/2015 CHECK CHECK CHECK CHECK VENDOR I.D. NAME STATUS DATE AMOUNT DISCOUNT NO STATUS AMOUNT 000138 Riley McLendon, LLC I-62648 Riley McLendon, LLC R 3/20/2015 019221 100 1530.521200.01 Prof Svcs-Legal Riley McLendon, LLC 12,500.00 I-62649 Riley McLendon, LLC R 3/20/2015 019221 100 1530.521200.02 Prof Svcs-Litigation Riley McLendon, LLC 1,500.00 I-62650 Riley McLendon, LLC R 3/20/2015 019221 100 2650.521200.03 Prof Svcs-Court Solicitor Riley McLendon, LLC 5,680.00 I-62651 Riley McLendon, LLC R 3/20/2015 019221 350 4200.541400.00 Infrastructure Riley McLendon, LLC 168.00 I-62652 Riley McLendon, LLC R 3/20/2015 019221 560 4320.521200.09 Prof Svcs-Stormwater Riley McLendon, LLC 452.16 I-62653 Riley McLendon, LLC R 3/20/2015 019221 350 4200.541400.00 Infrastructure Riley McLendon, LLC 108.00 20,408.16 000150 Fidelity Security Life Insuran I-2390734 Fidelity Security Life Insuran R 3/20/2015 019222 100 0000.121300.12 EE-Vision Payable Fidelity Security Li 498.98 498.98 000151 Wolfe, Timothy W. I-2/5/2015 Wolfe, Timothy W. R 3/20/2015 019223 100 2650.521200.00 Prof Svcs Wolfe, Timothy W. 400.00 400.00 000159 Purchase Power I-March 2015 Purchase Power R 3/20/2015 019224 100 1110.523200.00 Communications Purchase Power 7.41 100 1320.523200.00 Communications Purchase Power 2.40 100 1330.523200.00 Communications Purchase Power 22.18 100 1512.523200.00 Communications Purchase Power 206.37 100 1516.523200.00 Communications Purchase Power 704.77 100 1517.523200.00 Communications Purchase Power 33.03 100 1530.523200.00 Communications Purchase Power 11.61 100 1565.523200.00 Communications Purchase Power 0.98 100 1570.523200.00 Communications Purchase Power 88.38 100 2650.523200.00 Communications Purchase Power 395.84 100 3200.523200.00 Communications Purchase Power 96.58 100 4100.523200.00 Communications Purchase Power 34.32 100 7000.523200.00 Communications Purchase Power 411.13 2,015.00 000160 Georgia Technology Authority I-924-660880215 Georgia Technology Authority R 3/20/2015 019225 100 3200.521300.00 Technical Svcs Georgia Technology A 19.71 I-924-660880814 Georgia Technology Authority R 3/20/2015 019225 100 3200.521300.00 Technical Svcs Georgia Technology A 39.41 59.12
SLIDE 70
4/21/2015 10:29 AM A/P HISTORY CHECK REPORT PAGE: 44 VENDOR SET: 01 City of Dunwoody, GA BANK: 03 Suntrust Disbursement Acc DATE RANGE: 1/01/2015 THRU 3/31/2015 CHECK CHECK CHECK CHECK VENDOR I.D. NAME STATUS DATE AMOUNT DISCOUNT NO STATUS AMOUNT 000165 Vulcan Materials Company I-11144128 Vulcan Materials Company R 3/20/2015 019226 560 4320.531100.00 Supplies Vulcan Materials Com 373.28 I-11147209 Vulcan Materials Company R 3/20/2015 019226 560 4320.522200.05 Rep & Maint-Riprap Program Vulcan Materials Com 201.90 I-11151334 Vulcan Materials Company R 3/20/2015 019226 100 4200.531100.00 Supplies Vulcan Materials Com 1,345.03 1,920.21 000183 Sprint I-24864957 Sprint R 3/20/2015 019227 100 3200.523200.00 Communications Sprint 5,219.12 5,219.12 000196 Georgia Management Agency, Inc I-58972 Georgia Management Agency, Inc R 3/20/2015 019228 560 4320.522200.00 Repairs & Maintenance Georgia Management A 26,001.83 100 4200.522200.02 R&M - Street Maintenance Georgia Management A 35,724.39 I-58985 Georgia Management Agency, Inc R 3/20/2015 019228 560 4320.522200.00 Repairs & Maintenance Georgia Management A 25,864.41 100 4200.522200.02 R&M - Street Maintenance Georgia Management A 35,675.57 123,266.20 000216 Strategic Datacom Inc I-8768 Strategic Datacom Inc R 3/20/2015 019229 100 3200.522200.00 Repairs & Maintenance Strategic Datacom In 280.00 280.00 000262 Dunwoody Chamber of Commerce I I-6583 Dunwoody Chamber of Commerce I R 3/20/2015 019230 100 1110.523600.00 Dues & Fees Dunwoody Chamber of 25.00 25.00 000269 DeKalb County Georgia I-6305622/Feb 2015 DeKalb County Georgia R 3/20/2015 019231 100 6200.531230.00 Utilities DeKalb County Georgi 2.20 I-6563314/Mar 2015 DeKalb County Georgia R 3/20/2015 019231 100 6200.531230.00 Utilities DeKalb County Georgi 9.50 11.70 000307 DeKalb County District Attorne I-15CV2066-5 DeKalb County District Attorne R 3/20/2015 019232 212 0000.351320.00 Cash Confiscation DeKalb County Distri 770.00 212 0000.351320.00 Cash Confiscation DeKalb County Distri 414.00 1,184.00 000307 DeKalb County District Attorne I-15CV2067-7 DeKalb County District Attorne R 3/20/2015 019233 212 0000.351320.00 Cash Confiscation DeKalb County Distri 200.00 212 0000.351320.00 Cash Confiscation DeKalb County Distri 292.30 492.30
SLIDE 71
4/21/2015 10:29 AM A/P HISTORY CHECK REPORT PAGE: 45 VENDOR SET: 01 City of Dunwoody, GA BANK: 03 Suntrust Disbursement Acc DATE RANGE: 1/01/2015 THRU 3/31/2015 CHECK CHECK CHECK CHECK VENDOR I.D. NAME STATUS DATE AMOUNT DISCOUNT NO STATUS AMOUNT 000331 Tyler Technologies, Inc I-025-118005 Tyler Technologies, Inc R 3/20/2015 019234 100 1512.522200.00 Repairs & Maintenance Tyler Technologies, 138.00 138.00 001009 Kimley-Horn and Associates, In I-019124000-0115 Kimley-Horn and Associates, In R 3/20/2015 019235 350 4200.541400.00 Infrastructure Kimley-Horn and Asso 836.80 836.80 001032 Clyde Armory I-13949 Clyde Armory R 3/20/2015 019236 100 3200.531100.02 Supplies-Firearms Clyde Armory 1,591.00 1,591.00 001037 Mauldin & Jenkins, LLC I-567066 Mauldin & Jenkins, LLC R 3/20/2015 019237 100 1512.521200.00 Professional Services Mauldin & Jenkins, 19,000.00 19,000.00 001086 Schiff Hardin LLP I-1981600 Schiff Hardin LLP R 3/20/2015 019238 100 1530.521200.02 Prof Svcs-Litigation Schiff Hardin LLP 3,619.75 3,619.75 001097 US Department of Homeland Secu I-SAVE-345292 US Department of Homeland Secu R 3/20/2015 019239 100 1516.521300.00 Technical Services US Department of Hom 25.00 25.00 001170 Hasley Recreation, Inc. I-14-478 Hasley Recreation, Inc. R 3/20/2015 019240 100 6200.522200.06 R&M-Parks Hasley Recreation, I 4,352.00 4,352.00 001187 APG PCE, LLC I-PC41-100/April 15 APG PCE, LLC R 3/20/2015 019241 100 0000.123310.00 Abated Rent APG PCE, LLC 42,754.13 42,754.13 001274 Nova Engineering and Environme I-0104194 Nova Engineering and Environme R 3/20/2015 019242 350 4200.541400.00 Infrastructure Nova Engineering and 4,027.75 4,027.75 001275 LMI Systems, Inc I-1048570 LMI Systems, Inc R 3/20/2015 019243 100 6200.522200.06 R&M-Parks LMI Systems, Inc 470.56 470.56 001316 Lose and Associates I-20150217 Lose and Associates R 3/20/2015 019244 350 6200.541200.00 Site improvements Lose and Associates 7,014.50 I-20150274 Lose and Associates R 3/20/2015 019244 100 6200.521200.00 Professional Services Lose and Associates 375.00 7,389.50
SLIDE 72
4/21/2015 10:29 AM A/P HISTORY CHECK REPORT PAGE: 46 VENDOR SET: 01 City of Dunwoody, GA BANK: 03 Suntrust Disbursement Acc DATE RANGE: 1/01/2015 THRU 3/31/2015 CHECK CHECK CHECK CHECK VENDOR I.D. NAME STATUS DATE AMOUNT DISCOUNT NO STATUS AMOUNT 001328 LexisNexis Risk Data Managemen I-1502895-20150228 LexisNexis Risk Data Managemen R 3/20/2015 019245 100 1511.521300.00 Technical Services LexisNexis Risk Data 50.00 50.00 001345 JEL Consulting Group, LLC I-218 JEL Consulting Group, LLC R 3/20/2015 019246 100 7500.521200.00 Professional Services JEL Consulting Group 2,500.00 2,500.00 001385 Wolverton and Associates, Inc. I-40300 Wolverton and Associates, Inc. R 3/20/2015 019247 350 4200.541400.00 Infrastructure Wolverton and Associ 2,136.69 2,136.69 001397 Weibel & Associates, Inc. I-15-11803 Weibel & Associates, Inc. R 3/20/2015 019248 100 7000.521300.00 Technical Svcs Weibel & Associates, 2,200.00 2,200.00 001444 Kenneth Wickham I-3/11/2015 Kenneth Wickham R 3/20/2015 019249 100 2650.521200.00 Prof Svcs Kenneth Wickham 400.00 400.00 001492 James Duncan and Associates, I I-386-14-07 James Duncan and Associates, I R 3/20/2015 019250 100 7000.521200.00 Prof Svcs James Duncan and Ass 18,940.00 18,940.00 001504 American Engineers, Inc I-95240 American Engineers, Inc R 3/20/2015 019251 350 4200.541400.00 Infrastructure American Engineers, 3,200.00 3,200.00 001517 Southern Premier Contractors, I-DUN-247A Southern Premier Contractors, R 3/20/2015 019252 560 4320.522200.00 Repairs & Maintenance Southern Premier Con 1,227.35 1,227.35 001528 GRT Systems Inc dba N American I-108842 GRT Systems Inc dba N American R 3/20/2015 019253 100 6200.522200.06 R&M-Parks GRT Systems Inc dba 85.00 85.00 001542 Southeastern Engineering Inc ( I-15665 Southeastern Engineering Inc ( R 3/20/2015 019254 560 4320.522200.00 Repairs & Maintenance Southeastern Enginee 1,862.50 1,862.50 001549 Gas South, LLC I-March 2015 Gas South, LLC R 3/20/2015 019255 100 6200.531230.00 Utilities Gas South, LLC 1,214.51 1,214.51
SLIDE 73
4/21/2015 10:29 AM A/P HISTORY CHECK REPORT PAGE: 47 VENDOR SET: 01 City of Dunwoody, GA BANK: 03 Suntrust Disbursement Acc DATE RANGE: 1/01/2015 THRU 3/31/2015 CHECK CHECK CHECK CHECK VENDOR I.D. NAME STATUS DATE AMOUNT DISCOUNT NO STATUS AMOUNT 001557 Enterprise Leasing Company of I-9FP4VS Enterprise Leasing Company of R 3/20/2015 019256 100 3200.531100.01 Supplies-Explorer Program Enterprise Leasing C 180.34 180.34 001625 5Guys Contracting, LLC I-0309-1 5Guys Contracting, LLC R 3/20/2015 019257 100 6200.522200.06 R&M-Parks 5Guys Contracting, L 3,900.00 3,900.00 001673 Aerial Innovations of Ga., Inc I-45402 Aerial Innovations of Ga., Inc R 3/20/2015 019258 100 7000.521300.00 Technical Svcs Aerial Innovations o 94.50 I-45486 Aerial Innovations of Ga., Inc R 3/20/2015 019258 100 7000.521300.00 Technical Svcs Aerial Innovations o 94.50 189.00 001689 Kacena Design, LLC I-1-Pernoshal Kacena Design, LLC R 3/20/2015 019259 100 6200.522200.06 R&M-Parks Kacena Design, LLC 396.34 I-3 Kacena Design, LLC R 3/20/2015 019259 100 6200.522200.06 R&M-Parks Kacena Design, LLC 1,000.00 1,396.34 001690 Oldcastle Precast Inc. I-410128945 Oldcastle Precast Inc. R 3/20/2015 019260 560 4320.531100.00 Supplies Oldcastle Precast In 433.45 433.45 001719 Perimeter Community Improvemen I-PCID 10853(8) Perimeter Community Improvemen R 3/20/2015 019261 250 4002.522200.12 Repairs & Maintenance - PTOP Perimeter Community 61,198.85 61,198.85 001728 Smith Real Estate I-CDR002 Smith Real Estate R 3/20/2015 019262 350 4200.541400.00 Infrastructure Smith Real Estate 3,400.00 3,400.00 001732 AT&T Mobility II LLC I-070155-1214 AT&T Mobility II LLC R 3/20/2015 019263 215 3800.523200.00 Communications AT&T Mobility II LLC 6,319.80 6,319.80 001739 Kelly Michael Hundley, LLC I-279 Kelly Michael Hundley, LLC R 3/20/2015 019264 100 7000.521200.00 Prof Svcs Kelly Michael Hundle 45.00 45.00 001756 Georgia Snacks I-118 Georgia Snacks R 3/20/2015 019265 100 1540.512900.00 Other Employment Benefits Georgia Snacks 800.00 800.00
SLIDE 74
4/21/2015 10:29 AM A/P HISTORY CHECK REPORT PAGE: 48 VENDOR SET: 01 City of Dunwoody, GA BANK: 03 Suntrust Disbursement Acc DATE RANGE: 1/01/2015 THRU 3/31/2015 CHECK CHECK CHECK CHECK VENDOR I.D. NAME STATUS DATE AMOUNT DISCOUNT NO STATUS AMOUNT 001787 Optech RWM, LLC I-D0215 Optech RWM, LLC R 3/20/2015 019266 100 4200.522200.05 R&M - Right of Way Maint Optech RWM, LLC 1,666.66 100 6200.522200.06 R&M-Parks Optech RWM, LLC 32,184.01 33,850.67 001799 Colliers International - Atlan I-March 2015 Colliers International - Atlan R 3/20/2015 019267 100 0000.381100.00 Rental Commissions Colliers Internation 362.25 362.25 001824 Veith Traffic Services, LLC I-3011-10 Veith Traffic Services, LLC R 3/20/2015 019268 100 4200.522200.03 R&M - Traffic Signals Veith Traffic Servic 390.00 390.00 001825 Randstad US LP I-R17414120 Randstad US LP R 3/20/2015 019269 100 7000.522200.00 Repairs & Maintenance Randstad US LP 488.86 I-R17447464 Randstad US LP R 3/20/2015 019269 100 7000.522200.00 Repairs & Maintenance Randstad US LP 423.61 912.47 001833 Marny Heit I-D00039936 Marny Heit R 3/20/2015 019270 100 2650.521200.04 Prof Svcs-Public Defender Marny Heit 120.00 I-D00040672 Marny Heit R 3/20/2015 019270 100 2650.521200.04 Prof Svcs-Public Defender Marny Heit 120.00 240.00 001841 Ed Castro Landscape, Inc. I-Pay App #4 Ed Castro Landscape, Inc. R 3/20/2015 019271 350 4200.541400.00 Infrastructure Ed Castro Landscape, 2,137.50 2,137.50 001861 EmpowerD Wellness I-March 2015 EmpowerD Wellness R 3/20/2015 019272 100 1540.512900.00 Other Employment Benefits EmpowerD Wellness 1,565.42 1,565.42 001862 Design Seven, Inc. I-03DPD15 Design Seven, Inc. R 3/20/2015 019273 100 1570.521200.00 Professional Services Design Seven, Inc. 200.00 200.00 001865 James Kelley Construction I-Final James Kelley Construction R 3/20/2015 019274 100 1565.522200.00 Repairs & Maintenance James Kelley Constru 4,172.50 4,172.50 001867 Southeast Culvert, Inc. I-0159819-IN Southeast Culvert, Inc. R 3/20/2015 019275 100 6200.522200.06 R&M-Parks Southeast Culvert, I 11,190.00 11,190.00
SLIDE 75
4/21/2015 10:29 AM A/P HISTORY CHECK REPORT PAGE: 49 VENDOR SET: 01 City of Dunwoody, GA BANK: 03 Suntrust Disbursement Acc DATE RANGE: 1/01/2015 THRU 3/31/2015 CHECK CHECK CHECK CHECK VENDOR I.D. NAME STATUS DATE AMOUNT DISCOUNT NO STATUS AMOUNT 001870 Health Point Chiropractic & We I-102372752 Health Point Chiropractic & We R 3/20/2015 019276 100 1540.512900.00 Other Employment Benefits Health Point Chiropr 385.00 385.00 001877 tyco SimplexGrinnell I-77559230 tyco SimplexGrinnell R 3/20/2015 019277 100 1565.522200.00 Repairs & Maintenance tyco SimplexGrinnell 398.00 398.00 001879 Sharp Business Systems I-AR608006 Sharp Business Systems R 3/20/2015 019278 212 3200.542000.00 Machinery & Equipment Sharp Business Syste 32,336.90 32,336.90 1 Dunwoody Pediatrics I-Bus Tax (2015 Dunwoody Pediatrics: R 3/20/2015 019279 100 0000.316100.00 Business & Occupation Tax Dunwoody Pediatrics: 125.00 125.00 1 Bob Mullen I-Costco Bob Mullen: R 3/20/2015 019280 100 1570.531300.00 Food Bob Mullen: 140.80 140.80 1 Christopher Bellew I-Notary Christopher Bellew: R 3/20/2015 019281 100 1330.531100.00 Supplies Christopher Bellew: 38.74 38.74 1 Bonus Building Care in Atlant I-Occ. Tax (2015) Bonus Building Care in Atlant: R 3/20/2015 019282 100 0000.316100.00 Business & Occupation Tax Bonus Building Care 96.02 96.02 1 Victoria Johnson I-Probation Overpay Victoria Johnson: R 3/20/2015 019283 100 0000.351170.00 Municipal Court Fines & ForfeiVictoria Johnson: 20.00 20.00 * * T O T A L S * * NO INVOICE AMOUNT DISCOUNTS CHECK AMOUNT REGULAR CHECKS: 360 2,672,095.29 0.00 2,672,095.29 HAND CHECKS: 0 0.00 0.00 0.00 DRAFTS: 50 2,014,439.13 0.00 2,014,439.13 EFT: 0 0.00 0.00 0.00 NON CHECKS: 0 0.00 0.00 0.00 VOID CHECKS: 0 VOID DEBITS 0.00 VOID CREDITS 0.00 0.00 0.00 TOTAL ERRORS: 0
SLIDE 76 4/21/2015 10:29 AM A/P HISTORY CHECK REPORT PAGE: 50 VENDOR SET: 01 City of Dunwoody, GA BANK: 03 Suntrust Disbursement Acc DATE RANGE: 1/01/2015 THRU 3/31/2015 ** G/L ACCOUNT TOTALS ** G/L ACCOUNT NAME AMOUNT
- 100 0000.115300.01 State of the City 3,090.00
100 0000.121100.00 AP Pending (Pooled Cash) 195,376.54 100 0000.121110.00 PCard A/P Control 324,756.83 100 0000.121300.01 Fed Withholding Payable 238.57 100 0000.121300.12 EE-Vision Payable 1,411.92 100 0000.121300.15 POAB Deduction Payable 1,960.00 100 0000.121300.16 Flex Spending Ded Payable 14,423.83 100 0000.121300.18 AFLAC Deductions Payable 3,840.56 100 0000.122500.03 Deferred Rev-Conference 5,000.00 100 0000.122500.05 Def Rev-DPD Christmas for Kids 500.00 100 0000.123310.00 Abated Rent 128,262.39 100 0000.127102.00 Bonding Escrows Payable 3,600.00 100 0000.127103.00 Special Event Sign Dep Payable 800.00 100 0000.314200.00 Alcoholic Beverage Excise Tax 20,825.52 100 0000.316100.00 Business & Occupation Tax 1,142.58 100 0000.321900.01 Other Licenses and permits 400.00 100 0000.323100.00 Bldg Structures & Equipment 100.00 100 0000.347900.00 Pavilion Rentals 200.00 100 0000.351170.00 Municipal Court Fines & Forfei 20.00 100 0000.381100.00 Rental Commissions 1,086.75 100 1110.512100.00 Group Insurance 16,118.40 100 1110.521300.00 Technical Services 198.99 100 1110.523200.00 Communications 590.71 100 1110.523500.00 Travel 991.06 100 1110.523600.00 Dues & Fees 660.15 100 1110.531100.00 Supplies 306.62 100 1320.512100.00 Group Insurance 4,944.13 100 1320.521200.00 Prof Svcs 2,260.70 100 1320.521300.00 Technical Services 450.00 100 1320.523200.00 Communications 415.96 100 1330.512100.00 Group Insurance 4,834.14 100 1330.521200.00 Prof Svcs 2,548.71 100 1330.522200.00 Repairs & Maintenance 17,860.99 100 1330.523200.00 Communications 312.76 100 1330.523300.00 Advertising 457.00 100 1330.531100.00 Supplies 38.74 100 1511.512100.00 Group Insurance 7,122.42 100 1511.521100.01 Official/Admin Svcs 337,099.74 100 1511.521200.00 Professional Services 3,874.98 100 1511.521300.00 Technical Services 150.00 100 1511.523200.00 Communications 591.49 100 1511.523600.00 Dues & Fees 47,259.00 100 1512.521200.00 Professional Services 25,119.63 100 1512.522200.00 Repairs & Maintenance 138.00 100 1512.523200.00 Communications 370.74 100 1512.523600.00 Dues & Fees 250.00
SLIDE 77 4/21/2015 10:29 AM A/P HISTORY CHECK REPORT PAGE: 51 VENDOR SET: 01 City of Dunwoody, GA BANK: 03 Suntrust Disbursement Acc DATE RANGE: 1/01/2015 THRU 3/31/2015 ** G/L ACCOUNT TOTALS ** G/L ACCOUNT NAME AMOUNT
- 100 1513.521200.00 Professional Services 330.00
100 1516.521300.00 Technical Services 75.00 100 1516.523200.00 Communications 835.93 100 1517.521300.00 Technical Services 336.00 100 1517.523200.00 Communications 889.29 100 1530.521200.00 Prof Svcs 63,000.00 100 1530.521200.01 Prof Svcs-Legal 37,518.00 100 1530.521200.02 Prof Svcs-Litigation 31,849.17 100 1530.523200.00 Communications 38.81 100 1535.521100.01 Official/Admin Svcs 92,493.30 100 1535.521300.00 Technical Services 10,000.00 100 1535.522200.00 Repairs & Maintenance 778.00 100 1535.523200.00 Communications 608.47 100 1540.512900.00 Other Employment Benefits 10,204.09 100 1540.521200.00 Professional Services 386.38 100 1540.521300.00 Technical Services 24.00 100 1540.523200.00 Communications 3.84 100 1565.522200.00 Repairs & Maintenance 9,090.65 100 1565.522300.00 Rentals 2,970.00 100 1565.523200.00 Communications 0.98 100 1565.531230.00 Electricity 7,816.70 100 1570.521100.01 Official/Admin Svcs 76,988.25 100 1570.521200.00 Professional Services 2,475.00 100 1570.521300.00 Technical Services 2,250.00 100 1570.523200.00 Communications 2,588.38 100 1570.523300.00 Advertising 9,450.00 100 1570.531300.00 Food 140.80 100 2650.511100.00 Regular Salaries 20.01 100 2650.512100.00 Group Insurance 9,543.39 100 2650.521200.00 Prof Svcs 11,000.00 100 2650.521200.03 Prof Svcs-Court Solicitor 17,710.00 100 2650.521200.04 Prof Svcs-Public Defender 1,330.00 100 2650.521300.00 Technical Svcs 4,072.64 100 2650.522200.00 Repairs & Maintenance 1,693.00 100 2650.523200.00 Communications 858.81 100 2650.523700.00 Education & Training 337.50 100 3200.512100.00 Group Insurance 278,799.44 100 3200.512700.00 Workers' Compensation 5,000.00 100 3200.521300.00 Technical Svcs 433.19 100 3200.522200.00 Repairs & Maintenance 1,242.50 100 3200.522200.01 Repairs & Maintenance-Software 875.00 100 3200.522200.02 Repairs & Maintenance-Vehicle 171.95 100 3200.522300.00 Rentals 912.00 100 3200.523100.01 Claims 1,782.57 100 3200.523200.00 Communications 23,970.04 100 3200.523600.00 Dues & Fees 487.50
SLIDE 78 4/21/2015 10:29 AM A/P HISTORY CHECK REPORT PAGE: 52 VENDOR SET: 01 City of Dunwoody, GA BANK: 03 Suntrust Disbursement Acc DATE RANGE: 1/01/2015 THRU 3/31/2015 ** G/L ACCOUNT TOTALS ** G/L ACCOUNT NAME AMOUNT
- 100 3200.523700.00 Education & Training 1,046.00
100 3200.531100.01 Supplies-Explorer Program 548.36 100 3200.531100.02 Supplies-Firearms 10,621.12 100 3200.531270.00 Gasoline 35,596.65 100 4100.512100.00 Group Insurance 7,044.89 100 4100.521100.01 Official/Admin Svcs 56,737.14 100 4100.521200.00 Prof Svcs 119.00 100 4100.521200.10 Tree Fund Expenses 875.00 100 4100.523200.00 Communications 399.71 100 4100.523500.00 Travel 475.13 100 4100.531100.00 Supplies 480.00 100 4100.531230.00 Electricity 112,059.86 100 4200.522200.02 R&M - Street Maintenance 134,427.82 100 4200.522200.03 R&M - Traffic Signals 13,759.50 100 4200.522200.05 R&M - Right of Way Maint 4,329.32 100 4200.523100.01 Insurance Claims 210.82 100 4200.531100.00 Supplies 11,318.37 100 6200.521100.01 Official/Admin Svcs 48,512.34 100 6200.521200.00 Professional Services 8,848.56 100 6200.522200.06 R&M-Parks 192,929.64 100 6200.523200.00 Communications 114.03 100 6200.523600.00 Dues & Fees 50.00 100 6200.531100.00 Supplies 21,150.00 100 6200.531230.00 Utilities 30,877.22 100 7000.521100.01 Official/Admin Svcs 516,274.08 100 7000.521200.00 Prof Svcs 24,430.00 100 7000.521300.00 Technical Svcs 26,766.57 100 7000.522200.00 Repairs & Maintenance 4,293.21 100 7000.523200.00 Communications 768.93 100 7000.531300.00 Food 27.99 100 7500.521200.00 Professional Services 7,500.00 100 7500.523300.00 Advertising 5,440.00 100 7500.523600.00 Dues & Fees 900.00 100 7500.531300.00 Food 70.18 *** FUND TOTAL *** 3,184,382.57 212 0000.127101.00 Seized Funds Payable 19,520.00 212 0000.351320.00 Cash Confiscation 6,029.00 212 3200.521300.00 Technical Services 17.86 212 3200.542000.00 Machinery & Equipment 32,336.90 *** FUND TOTAL *** 57,903.76 215 3800.523200.00 Communications 21,060.55 215 3800.571000.00 Intergovernmental-E911 281,250.00 *** FUND TOTAL *** 302,310.55
SLIDE 79 4/21/2015 10:29 AM A/P HISTORY CHECK REPORT PAGE: 53 VENDOR SET: 01 City of Dunwoody, GA BANK: 03 Suntrust Disbursement Acc DATE RANGE: 1/01/2015 THRU 3/31/2015 ** G/L ACCOUNT TOTALS ** G/L ACCOUNT NAME AMOUNT
- 250 4002.522200.12 Repairs & Maintenance - PTOP 95,117.13
250 4002.541400.14 TAP-Infrastructure 27,091.05 250 4005.541400.14 Commuter Trail-Infrastructure 1,596.67 250 4006.541400.14 Bike Impl Plan-Infrastructure 15,992.19 *** FUND TOTAL *** 139,797.04 350 1535.542000.00 Machinery & Equipment 9,908.19 350 1565.541300.00 Buildings 38,160.95 350 3200.542000.00 Machinery & Equipment 377,074.00 350 4200.521200.00 Professional Services 9,089.87 350 4200.522200.00 Repairs & Maintenance 35,221.24 350 4200.541400.00 Infrastructure 192,202.78 350 6200.521200.00 Professional Services 39,730.50 350 6200.541200.00 Site improvements 45,114.65 350 6200.541400.00 Infrastructure 91,179.47 350 6200.542000.00 Machinery & Equipment 25,750.00 *** FUND TOTAL *** 863,431.65 560 4320.521100.01 Official/Admin Svcs 26,700.00 560 4320.521200.09 Prof Svcs-Stormwater 11,232.16 560 4320.522200.00 Repairs & Maintenance 94,656.34 560 4320.522200.05 Rep & Maint-Riprap Program 201.90 560 4320.531100.00 Supplies 5,605.62 *** FUND TOTAL *** 138,396.02 960 6200.523600.00 Dues & Fees 312.83 *** FUND TOTAL *** 312.83 NO INVOICE AMOUNT DISCOUNTS CHECK AMOUNT VENDOR SET: 01 BANK: 03 TOTALS: 410 4,686,534.42 0.00 4,686,534.42 BANK: 03 TOTALS: 410 4,686,534.42 0.00 4,686,534.42
SLIDE 80
4/21/2015 10:29 AM A/P HISTORY CHECK REPORT PAGE: 54 VENDOR SET: 01 City of Dunwoody, GA BANK: 05 Suntrust Municipal Court DATE RANGE: 1/01/2015 THRU 3/31/2015 CHECK CHECK CHECK CHECK VENDOR I.D. NAME STATUS DATE AMOUNT DISCOUNT NO STATUS AMOUNT 000278 DeKalb State Court I-Jean Joseph 20851 DeKalb State Court R 1/09/2015 203008 745 0000.121500.01 Jail Bonds Payable DeKalb State Court 350.00 350.00 1 GOMEZ, HUGO A I-000201412262672 GOMEZ, HUGO A: R 1/09/2015 203009 745 0000.121500.01 Jail Bonds Payable Bond Refund:D0003985 250.00 745 0000.121500.01 Jail Bonds Payable Bond Refund:D0003986 730.00 980.00 1 DICKSON, MICHAEL ABENDROTH I-000201412262673 DICKSON, MICHAEL ABENDROTH: R 1/09/2015 203010 745 0000.121500.01 Jail Bonds Payable Bond Refund:D0003913 150.00 150.00 1 BERGER, ALLEN BLAKE I-000201412262674 BERGER, ALLEN BLAKE: R 1/09/2015 203011 745 0000.121500.01 Jail Bonds Payable Bond Refund:D0003372 350.00 350.00 1 BROWN, HUGH I-000201412262675 BROWN, HUGH: R 1/09/2015 203012 745 0000.121500.01 Jail Bonds Payable Bond Refund:D0003780 350.00 350.00 1 COX, JOHN WARREN I-000201412262676 COX, JOHN WARREN: R 1/09/2015 203013 745 0000.121500.01 Jail Bonds Payable Bond Refund:D0003840 150.00 150.00 1 HARRIOTT, STEVENSON I-000201412262677 HARRIOTT, STEVENSON: R 1/09/2015 203014 745 0000.121500.01 Jail Bonds Payable Bond Refund:D0003971 350.00 350.00 1 MISHAEL, ABRAHAM I-000201412262678 MISHAEL, ABRAHAM: R 1/09/2015 203015 745 0000.121500.01 Jail Bonds Payable Bond Refund:D0003979 150.00 150.00 1 COER, DIONNE I-000201412262679 COER, DIONNE: R 1/09/2015 203016 745 0000.121500.01 Jail Bonds Payable Bond Refund:D0003984 400.00 400.00 1 RUSSELL, LAJARVIS MONTRELL I-000201412262680 RUSSELL, LAJARVIS MONTRELL: R 1/09/2015 203017 745 0000.121500.01 Jail Bonds Payable Bond Refund:D0004001 350.00 350.00 1 HILL, ANGELA LYNN I-000201412262681 HILL, ANGELA LYNN: R 1/09/2015 203018 745 0000.121500.01 Jail Bonds Payable Bond Refund:D0004004 150.00 150.00
SLIDE 81
4/21/2015 10:29 AM A/P HISTORY CHECK REPORT PAGE: 55 VENDOR SET: 01 City of Dunwoody, GA BANK: 05 Suntrust Municipal Court DATE RANGE: 1/01/2015 THRU 3/31/2015 CHECK CHECK CHECK CHECK VENDOR I.D. NAME STATUS DATE AMOUNT DISCOUNT NO STATUS AMOUNT 1 MOORE, KIMBERLY SHEVETT I-000201412262682 MOORE, KIMBERLY SHEVETT: R 1/09/2015 203019 745 0000.121500.01 Jail Bonds Payable Bond Refund:D0004004 150.00 150.00 000115 DeKalb County Jail I-December 2014 DeKalb County Jail R 1/23/2015 203020 745 0000.121800.00 Due to State Agencies DeKalb County Jail 27.32 27.32 000116 DeKalb County Finance Dept. I-December 2014 DeKalb County Finance Dept. R 1/23/2015 203021 745 0000.121800.00 Due to State Agencies DeKalb County Financ 4,903.79 4,903.79 000118 Peace Officers' I-Dec 2014 Peace Officers' R 1/23/2015 203022 745 0000.121800.00 Due to State Agencies Peace Officers' 4,510.60 4,510.60 000146 GSCCCA I-December 2014 GSCCCA R 1/23/2015 203023 745 0000.121800.00 Due to State Agencies GSCCCA 19,283.28 19,283.28 000278 DeKalb State Court I-D00037616-18 DeKalb State Court R 1/23/2015 203024 745 0000.121500.01 Jail Bonds Payable DeKalb State Court 1,650.00 1,650.00 000278 DeKalb State Court I-D00040195 DeKalb State Court R 1/23/2015 203025 745 0000.121500.01 Jail Bonds Payable DeKalb State Court 350.00 350.00 000278 DeKalb State Court I-D00041072 DeKalb State Court R 1/23/2015 203026 745 0000.121500.01 Jail Bonds Payable DeKalb State Court 730.00 730.00 001062 DeKalb Co Drug Abuse Treatment I-December 2014 DeKalb Co Drug Abuse Treatment R 1/23/2015 203027 745 0000.121800.00 Due to State Agencies DeKalb Co Drug Abuse 1,284.47 1,284.47 1 KINSEY, LATORIE A I-000201501162710 KINSEY, LATORIE A: R 1/23/2015 203028 745 0000.121500.01 Jail Bonds Payable Bond Refund:D0002569 1,455.00 1,455.00 1 HOUSTON, RUEBEN JAMES I-000201501162711 HOUSTON, RUEBEN JAMES: R 1/23/2015 203029 745 0000.121500.01 Jail Bonds Payable Bond Refund:D0002569 200.00 200.00
SLIDE 82
4/21/2015 10:29 AM A/P HISTORY CHECK REPORT PAGE: 56 VENDOR SET: 01 City of Dunwoody, GA BANK: 05 Suntrust Municipal Court DATE RANGE: 1/01/2015 THRU 3/31/2015 CHECK CHECK CHECK CHECK VENDOR I.D. NAME STATUS DATE AMOUNT DISCOUNT NO STATUS AMOUNT 1 FLEMING, KATHLEEN SPINELLI I-000201501162712 FLEMING, KATHLEEN SPINELLI: R 1/23/2015 203030 745 0000.121500.01 Jail Bonds Payable Bond Refund:D0003734 325.00 745 0000.121500.01 Jail Bonds Payable Bond Refund:D0003734 339.50 664.50 1 TANGE, EMMANUEL B I-000201501162713 TANGE, EMMANUEL B: R 1/23/2015 203031 745 0000.121500.01 Jail Bonds Payable Bond Refund:D0003672 730.00 745 0000.121500.01 Jail Bonds Payable Bond Refund:F36727 200.00 930.00 1 SMITH JR, DOUGLAS WAYNE I-000201501162714 SMITH JR, DOUGLAS WAYNE: R 1/23/2015 203032 745 0000.121500.01 Jail Bonds Payable Bond Refund:D0003889 4.00 4.00 1 MARTINEZ MEDINA, JUSTINA I-000201501162715 MARTINEZ MEDINA, JUSTINA: R 1/23/2015 203033 745 0000.121500.01 Jail Bonds Payable Bond Refund:D0003905 830.00 830.00 1 TYLER, ROBERT I-000201501162716 TYLER, ROBERT: R 1/23/2015 203034 745 0000.121500.01 Jail Bonds Payable Bond Refund:D0003934 350.00 350.00 1 LOPEZ FELIPE, IRMA PATRICIA I-000201501162717 LOPEZ FELIPE, IRMA PATRICIA: R 1/23/2015 203035 745 0000.121500.01 Jail Bonds Payable Bond Refund:D0003963 730.00 730.00 1 RUSSELL, LAJARVIS MONTRELL I-000201501162718 RUSSELL, LAJARVIS MONTRELL: R 1/23/2015 203036 745 0000.121500.01 Jail Bonds Payable Bond Refund:D0004001 350.00 350.00 1 FERGUSON, KALIAH LATRICE I-000201501162719 FERGUSON, KALIAH LATRICE: R 1/23/2015 203037 745 0000.121500.01 Jail Bonds Payable Bond Refund:D0004012 200.00 200.00 1 NGYUEN, JOHNNY NAM I-000201501162720 NGYUEN, JOHNNY NAM: R 1/23/2015 203038 745 0000.121500.01 Jail Bonds Payable Bond Refund:D0004012 605.00 605.00 1 REYES, MICHELLE LYNN I-000201501162721 REYES, MICHELLE LYNN: R 1/23/2015 203039 745 0000.121500.01 Jail Bonds Payable Bond Refund:D0004012 350.00 350.00 1 RODRIGUEZ-ARREOLA, CARLOS E I-000201501162722 RODRIGUEZ-ARREOLA, CARLOS E: R 1/23/2015 203040 745 0000.121500.01 Jail Bonds Payable Bond Refund:D0004022 730.00 745 0000.121500.01 Jail Bonds Payable Bond Refund:D0004022 75.00 805.00
SLIDE 83
4/21/2015 10:29 AM A/P HISTORY CHECK REPORT PAGE: 57 VENDOR SET: 01 City of Dunwoody, GA BANK: 05 Suntrust Municipal Court DATE RANGE: 1/01/2015 THRU 3/31/2015 CHECK CHECK CHECK CHECK VENDOR I.D. NAME STATUS DATE AMOUNT DISCOUNT NO STATUS AMOUNT 1 LUMPRIS-MIESES, CRISTINA I-000201501162723 LUMPRIS-MIESES, CRISTINA: R 1/23/2015 203041 745 0000.121500.01 Jail Bonds Payable Bond Refund:D0004040 750.00 745 0000.121500.01 Jail Bonds Payable Bond Refund:D0004040 350.00 745 0000.121500.01 Jail Bonds Payable Bond Refund:D0004041 200.00 1,300.00 1 ROGERS, TROY DONAHUE I-000201501162724 ROGERS, TROY DONAHUE: R 1/23/2015 203042 745 0000.121500.01 Jail Bonds Payable Bond Refund:D0004044 350.00 350.00 1 TODD, ERIKA SHANTELLA I-000201501162725 TODD, ERIKA SHANTELLA: R 1/23/2015 203043 745 0000.121500.01 Jail Bonds Payable Bond Refund:D0004061 350.00 350.00 1 FERGUSON, KALIAH LATRICE I-000201501162726 FERGUSON, KALIAH LATRICE: R 1/23/2015 203044 745 0000.121500.01 Jail Bonds Payable Bond Refund:D0004012 200.00 200.00 1 Cesar Roblero Rodriguez I-Cesar Rodriguez Cesar Roblero Rodriguez: R 1/23/2015 203045 745 0000.121500.01 Jail Bonds Payable Cesar Roblero Rodrig 730.00 730.00 000278 DeKalb State Court I-D000040283 DeKalb State Court R 2/06/2015 203046 745 0000.121500.01 Jail Bonds Payable DeKalb State Court 730.00 730.00 000278 DeKalb State Court I-D00035883 DeKalb State Court R 2/06/2015 203047 745 0000.121500.01 Jail Bonds Payable DeKalb State Court 1,460.00 1,460.00 000278 DeKalb State Court I-D000378721 DeKalb State Court R 2/06/2015 203048 745 0000.121500.01 Jail Bonds Payable DeKalb State Court 1,750.00 1,750.00 000278 DeKalb State Court I-D00040482 DeKalb State Court R 2/06/2015 203049 745 0000.121500.01 Jail Bonds Payable DeKalb State Court 250.00 250.00 000278 DeKalb State Court I-D00040535 DeKalb State Court R 2/06/2015 203050 745 0000.121500.01 Jail Bonds Payable DeKalb State Court 350.00 350.00 000278 DeKalb State Court I-D00040654 DeKalb State Court R 2/06/2015 203051 745 0000.121500.01 Jail Bonds Payable DeKalb State Court 350.00 350.00
SLIDE 84
4/21/2015 10:29 AM A/P HISTORY CHECK REPORT PAGE: 58 VENDOR SET: 01 City of Dunwoody, GA BANK: 05 Suntrust Municipal Court DATE RANGE: 1/01/2015 THRU 3/31/2015 CHECK CHECK CHECK CHECK VENDOR I.D. NAME STATUS DATE AMOUNT DISCOUNT NO STATUS AMOUNT 000278 DeKalb State Court I-D00040782-83 DeKalb State Court R 2/06/2015 203052 745 0000.121500.01 Jail Bonds Payable DeKalb State Court 805.00 805.00 1 SONG, KENNY JUNIL I-000201501302729 SONG, KENNY JUNIL: R 2/06/2015 203053 745 0000.121500.01 Jail Bonds Payable Bond Refund:D0003283 100.00 100.00 1 FERGUSON, COLE A I-000201501302730 FERGUSON, COLE A: R 2/06/2015 203054 745 0000.121500.01 Jail Bonds Payable Bond Refund:D0003389 350.00 350.00 1 HO, LIGHTSEY CANAAN I-000201501302731 HO, LIGHTSEY CANAAN: R 2/06/2015 203055 745 0000.121500.01 Jail Bonds Payable Bond Refund:D0003489 950.00 950.00 1 SMITH, JASMINE RENA I-000201501302732 SMITH, JASMINE RENA: R 2/06/2015 203056 745 0000.121500.01 Jail Bonds Payable Bond Refund:D0003149 350.00 350.00 1 GETTY, RICHARD L I-000201501302733 GETTY, RICHARD L: R 2/06/2015 203057 745 0000.121500.01 Jail Bonds Payable Bond Refund:D0004087 15.00 745 0000.121500.01 Jail Bonds Payable Bond Refund:D0004087 730.00 745.00 1 MONROE, SHANIQUA C I-000201501302734 MONROE, SHANIQUA C: R 2/06/2015 203058 745 0000.121500.01 Jail Bonds Payable Bond Refund:D0004084 350.00 350.00 1 LE, THUY NGOC I-000201501302735 LE, THUY NGOC: R 2/06/2015 203059 745 0000.121500.01 Jail Bonds Payable Bond Refund:D0003930 350.00 350.00 1 SCHAUERMAN, KIMBERLY ANN I-000201501302737 SCHAUERMAN, KIMBERLY ANN: R 2/06/2015 203061 745 0000.121500.01 Jail Bonds Payable Bond Refund:D0003945 178.00 745 0000.121500.01 Jail Bonds Payable Bond Refund:D0003945 730.00 908.00 1 DUBROF, DAVID LOUIS I-000201501302738 DUBROF, DAVID LOUIS: R 2/06/2015 203062 745 0000.121500.01 Jail Bonds Payable Bond Refund:D0004053 350.00 350.00 1 SAENZ-OLVERA, GLORIA I-000201501302739 SAENZ-OLVERA, GLORIA: R 2/06/2015 203063 745 0000.121500.01 Jail Bonds Payable Bond Refund:D0004055 155.00 155.00
SLIDE 85
4/21/2015 10:29 AM A/P HISTORY CHECK REPORT PAGE: 59 VENDOR SET: 01 City of Dunwoody, GA BANK: 05 Suntrust Municipal Court DATE RANGE: 1/01/2015 THRU 3/31/2015 CHECK CHECK CHECK CHECK VENDOR I.D. NAME STATUS DATE AMOUNT DISCOUNT NO STATUS AMOUNT 1 MITCHELL, KRISTIE MICHELLE I-000201501302740 MITCHELL, KRISTIE MICHELLE: R 2/06/2015 203064 745 0000.121500.01 Jail Bonds Payable Bond Refund:D0004058 350.00 350.00 1 PRIVETTE, DONALD WAYNE I-000201501302741 PRIVETTE, DONALD WAYNE: R 2/06/2015 203065 745 0000.121500.01 Jail Bonds Payable Bond Refund:D0004064 350.00 350.00 1 GAMBOA SOSA, MIGUEL A I-000201501302742 GAMBOA SOSA, MIGUEL A: R 2/06/2015 203066 745 0000.121500.01 Jail Bonds Payable Bond Refund:D0004079 908.00 908.00 1 RIVERA-HERRERA, FELIPE I-000201501302744 RIVERA-HERRERA, FELIPE: R 2/06/2015 203068 745 0000.121500.01 Jail Bonds Payable Bond Refund:D0004150 350.00 350.00 1 KELLER, MARC I-000201501302745 KELLER, MARC: R 2/06/2015 203069 745 0000.121500.01 Jail Bonds Payable Bond Refund:D0004153 350.00 350.00 1 AGUILAR-LIMETA, DANIEL I-000201501302746 AGUILAR-LIMETA, DANIEL: R 2/06/2015 203070 745 0000.121500.01 Jail Bonds Payable Bond Refund:D0004154 50.00 50.00 1 COWAN, FELICIA BEVERLY I-000201501302747 COWAN, FELICIA BEVERLY: R 2/06/2015 203071 745 0000.121500.01 Jail Bonds Payable Bond Refund:D0003819 730.00 745 0000.121500.01 Jail Bonds Payable Bond Refund:D0003819 126.00 745 0000.121500.01 Jail Bonds Payable Bond Refund:D0003819 400.00 745 0000.121500.01 Jail Bonds Payable Bond Refund:F38197 200.00 1,456.00 1 HOUSTON, QUINTARIOUS I-000201501302748 HOUSTON, QUINTARIOUS: R 2/06/2015 203072 745 0000.121500.01 Jail Bonds Payable Bond Refund:D0003579 350.00 350.00 1 Derrick Anthony Chin I-Derrick Chin (2) Derrick Anthony Chin: R 2/06/2015 203073 745 0000.121500.01 Jail Bonds Payable Derrick Anthony Chin 700.00 700.00 000116 DeKalb County Finance Dept. I-January 2015 DeKalb County Finance Dept. R 2/20/2015 203074 745 0000.121800.00 Due to State Agencies DeKalb County Financ 3,828.97 3,828.97
SLIDE 86
4/21/2015 10:29 AM A/P HISTORY CHECK REPORT PAGE: 60 VENDOR SET: 01 City of Dunwoody, GA BANK: 05 Suntrust Municipal Court DATE RANGE: 1/01/2015 THRU 3/31/2015 CHECK CHECK CHECK CHECK VENDOR I.D. NAME STATUS DATE AMOUNT DISCOUNT NO STATUS AMOUNT 000118 Peace Officers' I-Jan 2015 Peace Officers' R 2/20/2015 203075 745 0000.121800.00 Due to State Agencies Peace Officers' 3,944.70 3,944.70 000146 GSCCCA I-January 2015 GSCCCA R 2/20/2015 203076 745 0000.121800.00 Due to State Agencies GSCCCA 16,742.33 16,742.33 000278 DeKalb State Court I-D00035200-01 DeKalb State Court R 2/20/2015 203077 745 0000.121500.01 Jail Bonds Payable DeKalb State Court 935.00 935.00 000278 DeKalb State Court I-D00037399-402 DeKalb State Court R 2/20/2015 203078 745 0000.121500.01 Jail Bonds Payable DeKalb State Court 1,140.00 1,140.00 000278 DeKalb State Court I-D00042316 DeKalb State Court R 2/20/2015 203079 745 0000.121500.01 Jail Bonds Payable DeKalb State Court 400.00 400.00 001062 DeKalb Co Drug Abuse Treatment I-January 2015 DeKalb Co Drug Abuse Treatment R 2/20/2015 203080 745 0000.121800.00 Due to State Agencies DeKalb Co Drug Abuse 879.48 879.48 1 PATTERSON, JACKIE I-000201502132749 PATTERSON, JACKIE: R 2/20/2015 203081 745 0000.121500.01 Jail Bonds Payable Bond Refund:D0003945 350.00 350.00 1 PEREZ, EMMANUEL O I-000201502132750 PEREZ, EMMANUEL O: R 2/20/2015 203082 745 0000.121500.01 Jail Bonds Payable Bond Refund:D0003738 365.00 365.00 1 LEE, SONNY YEAHEE I-000201502132751 LEE, SONNY YEAHEE: R 2/20/2015 203083 745 0000.121500.01 Jail Bonds Payable Bond Refund:D0003457 350.00 350.00 1 LIGHTSEY, JULIE A I-000201502132752 LIGHTSEY, JULIE A: R 2/20/2015 203084 745 0000.121500.01 Jail Bonds Payable Bond Refund:23166 350.00 350.00 1 ONYEBUEKE, HART CHIBUZO I-000201502132753 ONYEBUEKE, HART CHIBUZO: R 2/20/2015 203085 745 0000.121500.01 Jail Bonds Payable Bond Refund:D0003958 350.00 350.00
SLIDE 87
4/21/2015 10:29 AM A/P HISTORY CHECK REPORT PAGE: 61 VENDOR SET: 01 City of Dunwoody, GA BANK: 05 Suntrust Municipal Court DATE RANGE: 1/01/2015 THRU 3/31/2015 CHECK CHECK CHECK CHECK VENDOR I.D. NAME STATUS DATE AMOUNT DISCOUNT NO STATUS AMOUNT 1 KNIGHT, NORMAN LYNN I-000201502132754 KNIGHT, NORMAN LYNN: R 2/20/2015 203086 745 0000.121500.01 Jail Bonds Payable Bond Refund:D0003978 339.50 339.50 1 HARRIS, NIKAR EBONEE N I-000201502132755 HARRIS, NIKAR EBONEE N: R 2/20/2015 203087 745 0000.121500.01 Jail Bonds Payable Bond Refund:D0003597 500.00 500.00 1 WATSON, MICHAEL SHAQUAN I-000201502132756 WATSON, MICHAEL SHAQUAN: R 2/20/2015 203088 745 0000.121500.01 Jail Bonds Payable Bond Refund:D0004120 730.00 745 0000.121500.01 Jail Bonds Payable Bond Refund:D0004121 178.00 745 0000.121500.01 Jail Bonds Payable Bond Refund:D0004121 350.00 1,258.00 1 DENT, YOUWNA MARIE I-000201502132757 DENT, YOUWNA MARIE: R 2/20/2015 203089 745 0000.121500.01 Jail Bonds Payable Bond Refund:D0004025 350.00 350.00 1 SAENZ-OLVERA, GLORIA I-000201502132758 SAENZ-OLVERA, GLORIA: R 2/20/2015 203090 745 0000.121500.01 Jail Bonds Payable Bond Refund:D0004055 50.00 745 0000.121500.01 Jail Bonds Payable Bond Refund:D0004056 730.00 780.00 1 SALGADO JR, FERNANDO I-000201502132759 SALGADO JR, FERNANDO: R 2/20/2015 203091 745 0000.121500.01 Jail Bonds Payable Bond Refund:D0004065 350.00 350.00 1 FULLER, HEIDI BALDWIN I-000201502132760 FULLER, HEIDI BALDWIN: R 2/20/2015 203092 745 0000.121500.01 Jail Bonds Payable Bond Refund:D0004082 350.00 350.00 1 SIMON, MICHAEL NEIL I-000201502132761 SIMON, MICHAEL NEIL: R 2/20/2015 203093 745 0000.121500.01 Jail Bonds Payable Bond Refund:D0004087 350.00 350.00 1 STEPHENSON, DANA CHRISTINE I-000201502132763 STEPHENSON, DANA CHRISTINE: R 2/20/2015 203095 745 0000.121500.01 Jail Bonds Payable Bond Refund:D0004103 730.00 745 0000.121500.01 Jail Bonds Payable Bond Refund:D0004103 75.00 805.00 1 SHIVERS, LAJERICA TOSHINA I-000201502132764 SHIVERS, LAJERICA TOSHINA: R 2/20/2015 203096 745 0000.121500.01 Jail Bonds Payable Bond Refund:D0004150 350.00 350.00
SLIDE 88
4/21/2015 10:29 AM A/P HISTORY CHECK REPORT PAGE: 62 VENDOR SET: 01 City of Dunwoody, GA BANK: 05 Suntrust Municipal Court DATE RANGE: 1/01/2015 THRU 3/31/2015 CHECK CHECK CHECK CHECK VENDOR I.D. NAME STATUS DATE AMOUNT DISCOUNT NO STATUS AMOUNT 1 HAND, JASMINE NICHOLE I-000201502132765 HAND, JASMINE NICHOLE: R 2/20/2015 203097 745 0000.121500.01 Jail Bonds Payable Bond Refund:D0004159 350.00 350.00 1 Jose Chavez Ortiz I-Jose Chavez Ortiz Jose Chavez Ortiz: R 2/20/2015 203098 745 0000.121500.01 Jail Bonds Payable Jose Chavez Ortiz: 1,857.00 1,857.00 000278 DeKalb State Court I-D00041266 DeKalb State Court R 3/06/2015 203099 745 0000.121500.01 Jail Bonds Payable DeKalb State Court 350.00 350.00 000278 DeKalb State Court I-D00041394 DeKalb State Court R 3/06/2015 203100 745 0000.121500.01 Jail Bonds Payable DeKalb State Court 400.00 400.00 1 PEREZ-BERNAL, JESUS I-000201503022766 PEREZ-BERNAL, JESUS: R 3/06/2015 203101 745 0000.121500.01 Jail Bonds Payable Bond Refund:D0004111 730.00 730.00 1 IVERSON, TAWANNA NICOLE I-000201503022767 IVERSON, TAWANNA NICOLE: R 3/06/2015 203102 745 0000.121500.01 Jail Bonds Payable Bond Refund:D0003920 250.00 250.00 1 PINEDA-GAMEZ, SILVIA C I-000201503022768 PINEDA-GAMEZ, SILVIA C: R 3/06/2015 203103 745 0000.121500.01 Jail Bonds Payable Bond Refund:D0004105 350.00 350.00 1 JABLONSKI, RADOSLAW I-000201503022769 JABLONSKI, RADOSLAW: R 3/06/2015 203104 745 0000.121500.01 Jail Bonds Payable Bond Refund:D0004081 350.00 745 0000.121500.01 Jail Bonds Payable Bond Refund:F40812 700.00 745 0000.121500.01 Jail Bonds Payable Bond Refund:F40812 200.00 1,250.00 1 HERNANDEZ ARIAS, BLANCA ESTHE I-000201503022770 HERNANDEZ ARIAS, BLANCA ESTHE: R 3/06/2015 203105 745 0000.121500.01 Jail Bonds Payable Bond Refund:D0004102 350.00 350.00 1 SHAMSIDDEEN, IBRAHIM B A I-000201503022771 SHAMSIDDEEN, IBRAHIM B A: R 3/06/2015 203106 745 0000.121500.01 Jail Bonds Payable Bond Refund:D0004102 350.00 350.00 1 VEGA-TREJO, EUGENIO I-000201503022772 VEGA-TREJO, EUGENIO: R 3/06/2015 203107 745 0000.121500.01 Jail Bonds Payable Bond Refund:D0004103 125.00 745 0000.121500.01 Jail Bonds Payable Bond Refund:D0004103 730.00 855.00
SLIDE 89
4/21/2015 10:29 AM A/P HISTORY CHECK REPORT PAGE: 63 VENDOR SET: 01 City of Dunwoody, GA BANK: 05 Suntrust Municipal Court DATE RANGE: 1/01/2015 THRU 3/31/2015 CHECK CHECK CHECK CHECK VENDOR I.D. NAME STATUS DATE AMOUNT DISCOUNT NO STATUS AMOUNT 1 MILLER, DONALD K I-000201503022773 MILLER, DONALD K: R 3/06/2015 203108 745 0000.121500.01 Jail Bonds Payable Bond Refund:D0004121 350.00 350.00 1 VILLASANA, KACANDRA M I-000201503022774 VILLASANA, KACANDRA M: R 3/06/2015 203109 745 0000.121500.01 Jail Bonds Payable Bond Refund:D0002802 1,000.00 745 0000.121500.01 Jail Bonds Payable Bond Refund:D0002802 200.00 1,200.00 1 VEREDIN, RICHIE HILARY I-000201503022775 VEREDIN, RICHIE HILARY: R 3/06/2015 203110 745 0000.121500.01 Jail Bonds Payable Bond Refund:D0004134 350.00 350.00 1 RIVERO-REYES, JORGE JOSE I-000201503022776 RIVERO-REYES, JORGE JOSE: R 3/06/2015 203111 745 0000.121500.01 Jail Bonds Payable Bond Refund:D0004158 78.00 78.00 1 CABAK ROSSELLE, BARBARA A I-000201503022777 CABAK ROSSELLE, BARBARA A: R 3/06/2015 203112 745 0000.121500.01 Jail Bonds Payable Bond Refund:D0004160 125.00 745 0000.121500.01 Jail Bonds Payable Bond Refund:D0004160 50.00 175.00 1 HERNANDEZ, RUFINO I-000201503022778 HERNANDEZ, RUFINO: R 3/06/2015 203113 745 0000.121500.01 Jail Bonds Payable Bond Refund:D0004160 50.00 50.00 1 Audra Vaz Harvey I-Audra Vaz Harvey Audra Vaz Harvey: R 3/06/2015 203114 745 0000.121500.01 Jail Bonds Payable Audra Vaz Harvey: 350.00 350.00 1 Ly S. Lam I-Ly S. Lam Ly S. Lam: R 3/06/2015 203115 745 0000.121500.01 Jail Bonds Payable Ly S. Lam: 1,080.00 1,080.00 000278 DeKalb State Court I-D00041601 DeKalb State Court R 3/20/2015 203116 745 0000.121500.01 Jail Bonds Payable DeKalb State Court 350.00 350.00 000278 DeKalb State Court I-D00041602 DeKalb State Court R 3/20/2015 203117 745 0000.121500.01 Jail Bonds Payable DeKalb State Court 750.00 750.00 000278 DeKalb State Court I-D00041637 DeKalb State Court R 3/20/2015 203118 745 0000.121500.01 Jail Bonds Payable DeKalb State Court 350.00 350.00
SLIDE 90
4/21/2015 10:29 AM A/P HISTORY CHECK REPORT PAGE: 64 VENDOR SET: 01 City of Dunwoody, GA BANK: 05 Suntrust Municipal Court DATE RANGE: 1/01/2015 THRU 3/31/2015 CHECK CHECK CHECK CHECK VENDOR I.D. NAME STATUS DATE AMOUNT DISCOUNT NO STATUS AMOUNT 000278 DeKalb State Court I-D00041655 DeKalb State Court R 3/20/2015 203119 745 0000.121500.01 Jail Bonds Payable DeKalb State Court 400.00 400.00 1 CONNORS, KATHLEEN A I-000201503132779 CONNORS, KATHLEEN A: R 3/20/2015 203120 745 0000.121500.01 Jail Bonds Payable Bond Refund:D0003954 125.00 745 0000.121500.01 Jail Bonds Payable Bond Refund:F39544 100.00 225.00 1 RAMOS LOPEZ, AURELIO I-000201503132780 RAMOS LOPEZ, AURELIO: R 3/20/2015 203121 745 0000.121500.01 Jail Bonds Payable Bond Refund:D0003913 930.00 930.00 1 STATEN, DONNA C I-000201503132781 STATEN, DONNA C: R 3/20/2015 203122 745 0000.121500.01 Jail Bonds Payable Bond Refund:D0004049 450.00 745 0000.121500.01 Jail Bonds Payable Bond Refund:D0004049 750.00 1,200.00 1 CARSON, ASHLEY LASHAI I-000201503132782 CARSON, ASHLEY LASHAI: R 3/20/2015 203123 745 0000.121500.01 Jail Bonds Payable Bond Refund:D0004157 350.00 350.00 1 MEJIA, EMERSON I-000201503132783 MEJIA, EMERSON: R 3/20/2015 203124 745 0000.121500.01 Jail Bonds Payable Bond Refund:D0004172 205.00 745 0000.121500.01 Jail Bonds Payable Bond Refund:D0004172 730.00 935.00 1 NELSON, SEAN ANTHONY I-000201503132784 NELSON, SEAN ANTHONY: R 3/20/2015 203125 745 0000.121500.01 Jail Bonds Payable Bond Refund:D0004171 350.00 350.00 1 SANDIFORD, SHAKIRA DONNA I-000201503132785 SANDIFORD, SHAKIRA DONNA: R 3/20/2015 203126 745 0000.121500.01 Jail Bonds Payable Bond Refund:D0004179 350.00 350.00 1 FAIRLEY, FREDERICK LAMAR I-000201503132786 FAIRLEY, FREDERICK LAMAR: R 3/20/2015 203127 745 0000.121500.01 Jail Bonds Payable Bond Refund:D0004179 350.00 350.00 1 WATERS, ALVIN CONRAD I-000201503132787 WATERS, ALVIN CONRAD: R 3/20/2015 203128 745 0000.121500.01 Jail Bonds Payable Bond Refund:D0004179 350.00 350.00
SLIDE 91 4/21/2015 10:29 AM A/P HISTORY CHECK REPORT PAGE: 65 VENDOR SET: 01 City of Dunwoody, GA BANK: 05 Suntrust Municipal Court DATE RANGE: 1/01/2015 THRU 3/31/2015 CHECK CHECK CHECK CHECK VENDOR I.D. NAME STATUS DATE AMOUNT DISCOUNT NO STATUS AMOUNT 1 QUINTANILLA-CAMARENA, JULIO C I-000201503132788 QUINTANILLA-CAMARENA, JULIO C: R 3/20/2015 203129 745 0000.121500.01 Jail Bonds Payable Bond Refund:D0004194 200.00 200.00 1 DIAZ MORALES, ELVIA ADALILA I-000201503132789 DIAZ MORALES, ELVIA ADALILA: R 3/20/2015 203130 745 0000.121500.01 Jail Bonds Payable Bond Refund:D0004194 28.00 28.00 1 MERCHANT, SALIM A I-000201503132790 MERCHANT, SALIM A: R 3/20/2015 203131 745 0000.121500.01 Jail Bonds Payable Bond Refund:22383 350.00 350.00 1 COPELAND, NAKIA NICOLE I-000201503132791 COPELAND, NAKIA NICOLE: R 3/20/2015 203132 745 0000.121500.01 Jail Bonds Payable Bond Refund:D0004199 400.00 400.00 1 BERCIAN, EDGAR RENE I-000201503132792 BERCIAN, EDGAR RENE: R 3/20/2015 203133 745 0000.121500.01 Jail Bonds Payable Bond Refund:D0004216 50.00 50.00 1 Nazario-Liborio, Leonor I-Nazario-Liborio, L Nazario-Liborio, Leonor: R 3/20/2015 203134 745 0000.121500.01 Jail Bonds Payable Nazario-Liborio, Leo 350.00 350.00 * * T O T A L S * * NO INVOICE AMOUNT DISCOUNTS CHECK AMOUNT REGULAR CHECKS: 124 116,250.94 0.00 116,250.94 HAND CHECKS: 0 0.00 0.00 0.00 DRAFTS: 0 0.00 0.00 0.00 EFT: 0 0.00 0.00 0.00 NON CHECKS: 0 0.00 0.00 0.00 VOID CHECKS: 0 VOID DEBITS 0.00 VOID CREDITS 0.00 0.00 0.00 TOTAL ERRORS: 0 ** G/L ACCOUNT TOTALS ** G/L ACCOUNT NAME AMOUNT
- 745 0000.121500.01 Jail Bonds Payable 60,846.00
745 0000.121800.00 Due to State Agencies 55,404.94 *** FUND TOTAL *** 116,250.94 NO INVOICE AMOUNT DISCOUNTS CHECK AMOUNT VENDOR SET: 01 BANK: 05 TOTALS: 124 116,250.94 0.00 116,250.94 BANK: 05 TOTALS: 124 116,250.94 0.00 116,250.94
SLIDE 92 4/21/2015 10:29 AM A/P HISTORY CHECK REPORT PAGE: 66 VENDOR SET: 01 City of Dunwoody, GA BANK: 06 PNC Municipal Court Cash DATE RANGE: 1/01/2015 THRU 3/31/2015 CHECK CHECK CHECK CHECK VENDOR I.D. NAME STATUS DATE AMOUNT DISCOUNT NO STATUS AMOUNT 001168 City of Dunwoody I-December 2014 City of Dunwoody R 1/09/2015 000021 745 0000.121900.01 Due to Other Funds-100 (SYS) City of Dunwoody 21,969.05 21,969.05 001168 City of Dunwoody I-January 2015 City of Dunwoody R 2/23/2015 000022 745 0000.121900.01 Due to Other Funds-100 (SYS) City of Dunwoody 14,305.72 14,305.72 001168 City of Dunwoody I-February 2015 City of Dunwoody R 3/06/2015 000023 745 0000.121900.01 Due to Other Funds-100 (SYS) City of Dunwoody 26,041.46 26,041.46 * * T O T A L S * * NO INVOICE AMOUNT DISCOUNTS CHECK AMOUNT REGULAR CHECKS: 3 62,316.23 0.00 62,316.23 HAND CHECKS: 0 0.00 0.00 0.00 DRAFTS: 0 0.00 0.00 0.00 EFT: 0 0.00 0.00 0.00 NON CHECKS: 0 0.00 0.00 0.00 VOID CHECKS: 0 VOID DEBITS 0.00 VOID CREDITS 0.00 0.00 0.00 TOTAL ERRORS: 0 ** G/L ACCOUNT TOTALS ** G/L ACCOUNT NAME AMOUNT
- 745 0000.121900.01 Due to Other Funds-100 (SYS) 62,316.23
*** FUND TOTAL *** 62,316.23 NO INVOICE AMOUNT DISCOUNTS CHECK AMOUNT VENDOR SET: 01 BANK: 06 TOTALS: 3 62,316.23 0.00 62,316.23 BANK: 06 TOTALS: 3 62,316.23 0.00 62,316.23
SLIDE 93
4/21/2015 10:29 AM A/P HISTORY CHECK REPORT PAGE: 67 VENDOR SET: 02 City of Dunwoody, GA BANK: 08 CVB of Dunwoody DATE RANGE: 1/01/2015 THRU 3/31/2015 CHECK CHECK CHECK CHECK VENDOR I.D. NAME STATUS DATE AMOUNT DISCOUNT NO STATUS AMOUNT 002086 United Healthcare I-0036771832 United Healthcare D 1/14/2015 000000 950 7540.512100.00 Employees/Personnel/Benefits United Healthcare 38.45 38.45 002086 United Healthcare I-0037014393 United Healthcare D 2/12/2015 000000 950 7540.512100.00 Employees/Personnel/Benefits United Healthcare 38.45 38.45 002086 United Healthcare I-0037269478 United Healthcare D 3/16/2015 000000 950 7540.512100.00 Employees/Personnel/Benefits United Healthcare 38.45 38.45 002002 Katherine A. Bishop I-Dec 2014 Katherine A. Bishop R 1/09/2015 041302 950 7540.523200.02 Admin/Telephone/Internet Katherine A. Bishop 75.00 950 7540.523500.01 Promotional/Travel Katherine A. Bishop 35.03 110.03 002066 Greater Georgia Life I-000289331F Greater Georgia Life R 1/09/2015 041304 950 7540.512100.00 Employees/Personnel/Benefits Greater Georgia Life 234.85 234.85 002067 Employment Screening Services I-207988 Employment Screening Services R 1/09/2015 041305 950 7540.523900.00 Admin/Miscellaneous Employment Screening 145.50 145.50 002068 Atlanta Metro Travel Associati I-2015-30 Atlanta Metro Travel Associati R 1/09/2015 041306 950 7540.523600.02 Marketing/Memberships Atlanta Metro Travel 275.00 275.00 002088 Andy Williams I-Dec 2014 Andy Williams R 1/09/2015 041307 950 7540.523200.02 Admin/Telephone/Internet Andy Williams 75.00 950 7540.523500.01 Promotional/Travel Andy Williams 40.68 115.68 002096 Coventry Dental I-20141215000446 Coventry Dental R 1/09/2015 041308 950 7540.512100.00 Employees/Personnel/Benefits Coventry Dental 92.08 92.08 002117 Comcast I-January 2015 Comcast R 1/09/2015 041309 950 7540.523200.02 Admin/Telephone/Internet Comcast 156.69 156.69 002160 Kim Trawick I-Dec 2014 Kim Trawick R 1/09/2015 041310 950 7540.523200.02 Admin/Telephone/Internet Kim Trawick 75.00 75.00
SLIDE 94
4/21/2015 10:29 AM A/P HISTORY CHECK REPORT PAGE: 68 VENDOR SET: 02 City of Dunwoody, GA BANK: 08 CVB of Dunwoody DATE RANGE: 1/01/2015 THRU 3/31/2015 CHECK CHECK CHECK CHECK VENDOR I.D. NAME STATUS DATE AMOUNT DISCOUNT NO STATUS AMOUNT 002174 Humana EMP HP Georgia I-629434937 Humana EMP HP Georgia R 1/09/2015 041311 950 7540.512100.00 Employees/Personnel/Benefits Humana EMP HP Georgi 3,306.08 3,306.08 002178 CSG Legal I-Jun-Dec 2014 Legal CSG Legal R 1/09/2015 041312 950 7540.521200.10 Admin/Legal & Professional FeeCSG Legal 4,130.00 4,130.00 002186 My Agency Savannah I-1193 My Agency Savannah R 1/09/2015 041313 950 7540.521200.12 Marketing/Graphic Design My Agency Savannah 1,200.00 I-1194 My Agency Savannah R 1/09/2015 041313 950 7540.521200.12 Marketing/Graphic Design My Agency Savannah 1,200.00 2,400.00 002209 Dawn Terrizzi I-January 2015 Dawn Terrizzi R 1/09/2015 041314 950 7540.531100.00 Admin/Office Expense Dawn Terrizzi 13.36 13.36 002210 Sarah Anne Steadman I-Dec 2014 Sarah Anne Steadman R 1/09/2015 041315 950 7540.523500.01 Promotional/Travel Sarah Anne Steadman 20.01 20.01 002217 Event Transportation/Atlanta I-ETA Event Transportation/Atlanta R 1/09/2015 041316 950 7540.523500.01 Promotional/Travel Event Transportation 286.50 286.50 002013 Collinson Media and Events I-22970 Collinson Media and Events R 1/23/2015 041317 950 7540.521300.01 Marketing/Website Marketing Collinson Media and 1,501.46 I-22971 Collinson Media and Events R 1/23/2015 041317 950 7540.521300.01 Marketing/Website Marketing Collinson Media and 2,000.00 I-22972 Collinson Media and Events R 1/23/2015 041317 950 7540.523300.01 Marketing/Advertising -DigitalCollinson Media and 6,907.73 10,409.19 002047 Simple View, Inc I-57614 Simple View, Inc R 1/23/2015 041318 950 7540.521300.00 Marketing/Website Management Simple View, Inc 500.00 I-58071 Simple View, Inc R 1/23/2015 041318 950 7540.523500.01 Promotional/Travel Simple View, Inc 2,070.00 2,570.00 002112 PKY Fund II Atlanta II, LLC I-2fd1258/Feb 2015 PKY Fund II Atlanta II, LLC R 1/23/2015 041319 950 7540.522300.00 Admin/Rent PKY Fund II Atlanta 3,561.36 3,561.36
SLIDE 95
4/21/2015 10:29 AM A/P HISTORY CHECK REPORT PAGE: 69 VENDOR SET: 02 City of Dunwoody, GA BANK: 08 CVB of Dunwoody DATE RANGE: 1/01/2015 THRU 3/31/2015 CHECK CHECK CHECK CHECK VENDOR I.D. NAME STATUS DATE AMOUNT DISCOUNT NO STATUS AMOUNT 002142 Ricoh Americas Corporation I-44087945 Ricoh Americas Corporation R 1/23/2015 041320 950 7540.522300.01 Admin/Equipment Lease Ricoh Americas Corpo 149.61 149.61 002211 Atlanta Journal-Constitution I-Oct & Nov 2014 Atlanta Journal-Constitution R 1/23/2015 041321 950 7540.523300.01 Marketing/Advertising -DigitalAtlanta Journal-Cons 5,000.00 5,000.00 002224 APG PCE, LLC I-Deposit - CVB APG PCE, LLC R 1/30/2015 041322 950 7540.522300.00 Admin/Rent APG PCE, LLC 8,835.61 I-First Month - CVB APG PCE, LLC R 1/30/2015 041322 950 7540.522300.00 Admin/Rent APG PCE, LLC 7,620.46 16,456.07 002024 Great Southern Publishers, Inc I-LM011515DC1 Great Southern Publishers, Inc R 2/06/2015 041323 950 7540.523600.01 Marketing/Dues & SubscriptionsGreat Southern Publi 550.00 550.00 002047 Simple View, Inc I-57452 Simple View, Inc R 2/06/2015 041324 950 7540.521300.00 Marketing/Website Management Simple View, Inc 702.00 702.00 002066 Greater Georgia Life I-000293128F Greater Georgia Life R 2/06/2015 041325 950 7540.512100.00 Employees/Personnel/Benefits Greater Georgia Life 11.17 11.17 002096 Coventry Dental I-20150115000448 Coventry Dental R 2/06/2015 041326 950 7540.512100.00 Employees/Personnel/Benefits Coventry Dental 92.08 92.08 002174 Humana EMP HP Georgia I-629434939 Humana EMP HP Georgia R 2/06/2015 041327 950 7540.512100.00 Employees/Personnel/Benefits Humana EMP HP Georgi 2,598.24 2,598.24 002209 Dawn Terrizzi I-Jan 2015 Dawn Terrizzi R 2/06/2015 041328 950 7540.531100.00 Admin/Office Expense Dawn Terrizzi 15.93 15.93 002002 Katherine A. Bishop I-February 2015 Katherine A. Bishop R 2/20/2015 041329 950 7540.523200.02 Admin/Telephone/Internet Katherine A. Bishop 75.00 75.00 002013 Collinson Media and Events I-30497 Collinson Media and Events R 2/20/2015 041330 950 7540.521300.01 Marketing/Website Marketing Collinson Media and 1,001.95 I-30503 Collinson Media and Events R 2/20/2015 041330 950 7540.521300.01 Marketing/Website Marketing Collinson Media and 2,000.00 3,001.95
SLIDE 96
4/21/2015 10:29 AM A/P HISTORY CHECK REPORT PAGE: 70 VENDOR SET: 02 City of Dunwoody, GA BANK: 08 CVB of Dunwoody DATE RANGE: 1/01/2015 THRU 3/31/2015 CHECK CHECK CHECK CHECK VENDOR I.D. NAME STATUS DATE AMOUNT DISCOUNT NO STATUS AMOUNT 002088 Andy Williams I-February 2015 Andy Williams R 2/20/2015 041331 950 7540.523200.02 Admin/Telephone/Internet Andy Williams 75.00 950 7540.523500.01 Promotional/Travel Andy Williams 108.10 183.10 002112 PKY Fund II Atlanta II, LLC I-2fd1258/March 2015 PKY Fund II Atlanta II, LLC R 2/20/2015 041332 950 7540.522300.00 Admin/Rent PKY Fund II Atlanta 3,561.36 3,561.36 002117 Comcast I-February 2015 Comcast R 2/20/2015 041333 950 7540.523200.02 Admin/Telephone/Internet Comcast 156.96 156.96 002160 Kim Trawick I-February 2015 Kim Trawick R 2/20/2015 041334 950 7540.523200.02 Admin/Telephone/Internet Kim Trawick 75.00 950 7540.523200.01 Admin/Postage/Courier/OvernighKim Trawick 39.20 950 7540.531300.02 Promotional/Meals & Busn DevelKim Trawick 36.23 950 7540.523500.01 Promotional/Travel Kim Trawick 101.82 252.25 002193 Pioneer Publishing, Inc. I-2015-8877 Pioneer Publishing, Inc. R 2/20/2015 041335 950 7540.523300.00 Marketing/Advertising - Print Pioneer Publishing, 1,400.00 1,400.00 002201 Pineapple Public Relations, In I-13-0115 Pineapple Public Relations, In R 2/20/2015 041336 950 7540.521200.20 Marketing/Public Relations Pineapple Public Rel 1,500.00 I-13-0215 Pineapple Public Relations, In R 2/20/2015 041336 950 7540.521200.20 Marketing/Public Relations Pineapple Public Rel 1,500.00 I-13-0315 Pineapple Public Relations, In R 2/20/2015 041336 950 7540.521200.20 Marketing/Public Relations Pineapple Public Rel 1,500.00 4,500.00 002210 Sarah Anne Steadman I-February 2015 Sarah Anne Steadman R 2/20/2015 041337 950 7540.523500.01 Promotional/Travel Sarah Anne Steadman 320.53 950 7540.531300.02 Promotional/Meals & Busn DevelSarah Anne Steadman 45.16 950 7540.521200.15 Promotional/Conv/Trade Shows Sarah Anne Steadman 118.00 483.69 002225 Gray Research Solutions, Inc. I-DGA1 Gray Research Solutions, Inc. R 2/20/2015 041338 950 7540.521300.03 Marketing/Research Gray Research Soluti 17,350.00 17,350.00 002002 Katherine A. Bishop I-Feb 2015 Katherine A. Bishop R 3/06/2015 041339 950 7540.523200.02 Admin/Telephone/Internet Katherine A. Bishop 75.00 950 7540.523500.02 Admin/Travel Katherine A. Bishop 281.75 950 7540.523500.01 Promotional/Travel Katherine A. Bishop 303.60 660.35
SLIDE 97
4/21/2015 10:29 AM A/P HISTORY CHECK REPORT PAGE: 71 VENDOR SET: 02 City of Dunwoody, GA BANK: 08 CVB of Dunwoody DATE RANGE: 1/01/2015 THRU 3/31/2015 CHECK CHECK CHECK CHECK VENDOR I.D. NAME STATUS DATE AMOUNT DISCOUNT NO STATUS AMOUNT 002028 Reunions Magazine, Inc I-18116 Reunions Magazine, Inc R 3/06/2015 041340 950 7540.523300.00 Marketing/Advertising - Print Reunions Magazine, I 2,000.00 2,000.00 002047 Simple View, Inc I-58844 Simple View, Inc R 3/06/2015 041341 950 7540.521300.00 Marketing/Website Management Simple View, Inc 500.00 500.00 002066 Greater Georgia Life I-000296851F Greater Georgia Life R 3/06/2015 041342 950 7540.512100.00 Employees/Personnel/Benefits Greater Georgia Life 67.86 67.86 002096 Coventry Dental I-201502160000421 Coventry Dental R 3/06/2015 041343 950 7540.512100.00 Employees/Personnel/Benefits Coventry Dental 92.08 92.08 002142 Ricoh Americas Corporation I-44512260 Ricoh Americas Corporation R 3/06/2015 041344 950 7540.522300.01 Admin/Equipment Lease Ricoh Americas Corpo 149.61 149.61 002160 Kim Trawick I-Feb 2015 Kim Trawick R 3/06/2015 041345 950 7540.523200.02 Admin/Telephone/Internet Kim Trawick 75.00 950 7540.523500.01 Promotional/Travel Kim Trawick 46.70 121.70 002165 Populace, Inc. I-1114 Populace, Inc. R 3/06/2015 041346 950 7540.521300.01 Marketing/Website Marketing Populace, Inc. 1,200.00 1,200.00 002174 Humana EMP HP Georgia I-629434926 Humana EMP HP Georgia R 3/06/2015 041347 950 7540.512100.00 Employees/Personnel/Benefits Humana EMP HP Georgi 2,598.24 2,598.24 002013 Collinson Media and Events I-21558 (2) Collinson Media and Events R 3/20/2015 041348 950 7540.523300.01 Marketing/Advertising -DigitalCollinson Media and 4,500.00 4,500.00 002081 Atlanta Business Chronicle I-14364 Atlanta Business Chronicle R 3/20/2015 041349 950 7540.523300.00 Marketing/Advertising - Print Atlanta Business Chr 8,250.00 I-15962 Atlanta Business Chronicle R 3/20/2015 041349 950 7540.523300.00 Marketing/Advertising - Print Atlanta Business Chr 4,950.00 13,200.00
SLIDE 98
4/21/2015 10:29 AM A/P HISTORY CHECK REPORT PAGE: 72 VENDOR SET: 02 City of Dunwoody, GA BANK: 08 CVB of Dunwoody DATE RANGE: 1/01/2015 THRU 3/31/2015 CHECK CHECK CHECK CHECK VENDOR I.D. NAME STATUS DATE AMOUNT DISCOUNT NO STATUS AMOUNT 002112 PKY Fund II Atlanta II, LLC I-2fd1258/April 2015 PKY Fund II Atlanta II, LLC R 3/20/2015 041350 950 7540.522300.00 Admin/Rent PKY Fund II Atlanta 5,342.04 5,342.04 002117 Comcast I-March 2015 Comcast R 3/20/2015 041351 950 7540.523200.02 Admin/Telephone/Internet Comcast 167.00 167.00 002169 Cvent, Inc. I-152238 Cvent, Inc. R 3/20/2015 041352 950 7540.523300.01 Marketing/Advertising -DigitalCvent, Inc. 14,566.00 14,566.00 002171 Traci with an Eye Graphics I-03/11/2015 Traci with an Eye Graphics R 3/20/2015 041353 950 7540.521200.21 Promotional/Promotions Traci with an Eye Gr 800.00 800.00 002177 Small Market Meetings Conferen I-50436 Small Market Meetings Conferen R 3/20/2015 041354 950 7540.521200.18 Promotional/Sponsorships Small Market Meeting 4,000.00 I-50437 Small Market Meetings Conferen R 3/20/2015 041354 950 7540.521200.15 Promotional/Conv/Trade Shows Small Market Meeting 1,595.00 I-50438 Small Market Meetings Conferen R 3/20/2015 041354 950 7540.523600.02 Marketing/Memberships Small Market Meeting 395.00 5,990.00 002217 Event Transportation/Atlanta I-ETA1635 Event Transportation/Atlanta R 3/20/2015 041355 950 7540.523500.01 Promotional/Travel Event Transportation 1,750.00 1,750.00 002226 Spruill Center for the Arts I-GW-152 Spruill Center for the Arts R 3/20/2015 041356 950 7540.521200.16 Promotional/Event Hosting&SiteSpruill Center for t 300.00 300.00 * * T O T A L S * * NO INVOICE AMOUNT DISCOUNTS CHECK AMOUNT REGULAR CHECKS: 54 138,445.62 0.00 138,445.62 HAND CHECKS: 0 0.00 0.00 0.00 DRAFTS: 3 115.35 0.00 115.35 EFT: 0 0.00 0.00 0.00 NON CHECKS: 0 0.00 0.00 0.00 VOID CHECKS: 0 VOID DEBITS 0.00 VOID CREDITS 0.00 0.00 0.00 TOTAL ERRORS: 0
SLIDE 99 4/21/2015 10:29 AM A/P HISTORY CHECK REPORT PAGE: 73 VENDOR SET: 02 City of Dunwoody, GA BANK: 08 CVB of Dunwoody DATE RANGE: 1/01/2015 THRU 3/31/2015 ** G/L ACCOUNT TOTALS ** G/L ACCOUNT NAME AMOUNT
- 950 7540.512100.00 Employees/Personnel/Benefits 9,208.03
950 7540.521200.10 Admin/Legal & Professional Fee 4,130.00 950 7540.521200.12 Marketing/Graphic Design 2,400.00 950 7540.521200.15 Promotional/Conv/Trade Shows 1,713.00 950 7540.521200.16 Promotional/Event Hosting&Site 300.00 950 7540.521200.18 Promotional/Sponsorships 4,000.00 950 7540.521200.20 Marketing/Public Relations 4,500.00 950 7540.521200.21 Promotional/Promotions 800.00 950 7540.521300.00 Marketing/Website Management 1,702.00 950 7540.521300.01 Marketing/Website Marketing 7,703.41 950 7540.521300.03 Marketing/Research 17,350.00 950 7540.522300.00 Admin/Rent 28,920.83 950 7540.522300.01 Admin/Equipment Lease 299.22 950 7540.523200.01 Admin/Postage/Courier/Overnigh 39.20 950 7540.523200.02 Admin/Telephone/Internet 1,080.65 950 7540.523300.00 Marketing/Advertising - Print 16,600.00 950 7540.523300.01 Marketing/Advertising -Digital 30,973.73 950 7540.523500.01 Promotional/Travel 5,082.97 950 7540.523500.02 Admin/Travel 281.75 950 7540.523600.01 Marketing/Dues & Subscriptions 550.00 950 7540.523600.02 Marketing/Memberships 670.00 950 7540.523900.00 Admin/Miscellaneous 145.50 950 7540.531100.00 Admin/Office Expense 29.29 950 7540.531300.02 Promotional/Meals & Busn Devel 81.39 *** FUND TOTAL *** 138,560.97 NO INVOICE AMOUNT DISCOUNTS CHECK AMOUNT VENDOR SET: 02 BANK: 08 TOTALS: 57 138,560.97 0.00 138,560.97 BANK: 08 TOTALS: 57 138,560.97 0.00 138,560.97 REPORT TOTALS: 609 4,947,100.37 0.00 5,111,927.72
SLIDE 100 4/21/2015 10:29 AM A/P HISTORY CHECK REPORT PAGE: 74 SELECTION CRITERIA
VENDOR: ALL BANK CODES: All FUNDS: All
CHECK RANGE: 000000 THRU 999999 DATE RANGE: 1/01/2015 THRU 3/31/2015 CHECK AMOUNT RANGE: 0.00 THRU 999,999,999.99 INCLUDE ALL VOIDS: YES
SEQUENCE: CHECK NUMBER PRINT TRANSACTIONS: YES PRINT G/L: YES UNPOSTED ONLY: NO EXCLUDE UNPOSTED: YES MANUAL ONLY: NO STUB COMMENTS: NO REPORT FOOTER: NO CHECK STATUS: NO PRINT STATUS: * - All