SLIDE 1 City of Dunwoody
YTD Statement of Revenues and Expenses Through October 31, 2015
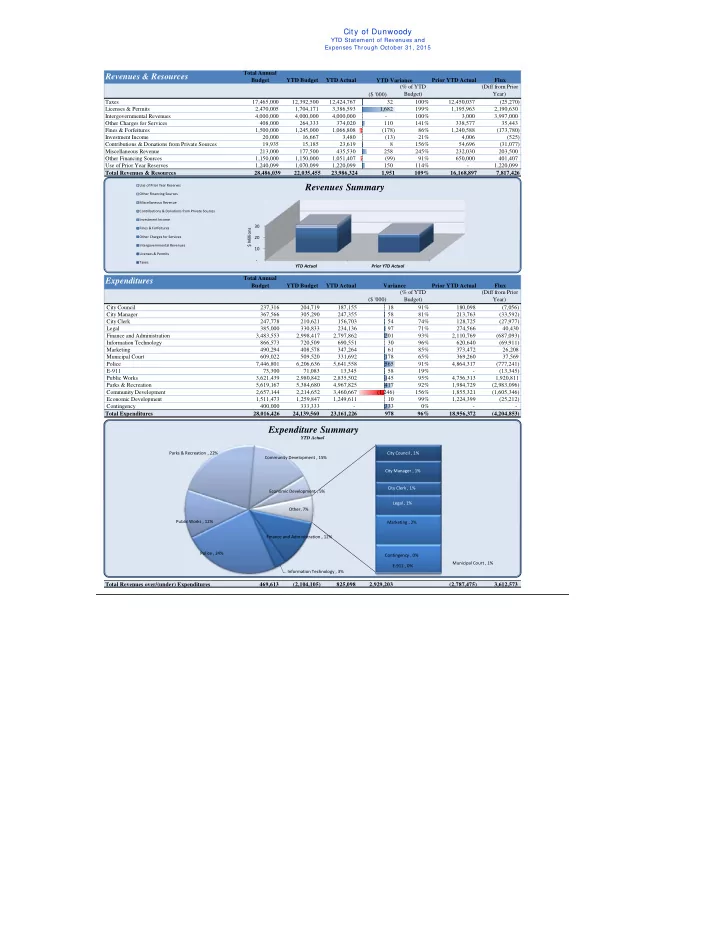
Revenues & Resources
Total Annual Budget YTD Budget YTD Actual Prior YTD Actual Flux ($ '000) (% of YTD Budget) (Diff from Prior Year) Taxes 17,465,000 12,392,500 12,424,767 32 100% 12,450,037 (25,270) Licenses & Permits 2,470,005 1,704,171 3,386,593 1,682 199% 1,195,963 2,190,630 Intergovernmental Revenues 4,000,000 4,000,000 4,000,000
3,000 3,997,000 Other Charges for Services 408,000 264,333 374,020 110 141% 338,577 35,443 Fines & Forfeitures 1,500,000 1,245,000 1,066,808 (178) 86% 1,240,588 (173,780) Investment Income 20,000 16,667 3,480 (13) 21% 4,006 (525) Contributions & Donations from Private Sources 19,935 15,185 23,619 8 156% 54,696 (31,077) Miscellaneous Revenue 213,000 177,500 435,530 258 245% 232,030 203,500 Other Financing Sources 1,150,000 1,150,000 1,051,407 (99) 91% 650,000 401,407 Use of Prior Year Reserves 1,240,099 1,070,099 1,220,099 150 114%
Total Revenues & Resources 28,486,039 22,035,455 23,986,324 1,951 109% 16,168,897 7,817,426
Expenditures
Total Annual Budget YTD Budget YTD Actual Prior YTD Actual Flux ($ '000) (% of YTD Budget) (Diff from Prior Year) City Council 237,316 204,719 187,155 18 91% 180,098 (7,056) City Manager 367,566 305,290 247,355 58 81% 213,763 (33,592) City Clerk 247,778 210,621 156,703 54 74% 128,725 (27,977) Legal 385,000 330,833 234,136 97 71% 274,566 40,430 Finance and Administration 3,483,553 2,998,417 2,797,862 201 93% 2,110,769 (687,093) Information Technology 866,573 720,509 690,551 30 96% 620,640 (69,911) Marketing 490,294 408,578 347,264 61 85% 373,472 26,208 Municipal Court 609,022 509,520 331,692 178 65% 369,260 37,569 Police 7,446,801 6,206,636 5,641,558 565 91% 4,864,317 (777,241) E-911 73,300 71,083 13,345 58 19% - (13,345) Public Works 3,621,439 2,980,842 2,835,502 145 95% 4,756,313 1,920,811 Parks & Recreation 5,619,167 5,384,680 4,967,825 417 92% 1,984,729 (2,983,096) Community Development 2,657,144 2,214,652 3,460,667 (1,246) 156% 1,855,321 (1,605,346) Economic Development 1,511,473 1,259,847 1,249,611 10 99% 1,224,399 (25,212) Contingency 400,000 333,333 - 333 0% - - Total Expenditures 28,016,426 24,139,560 23,161,226 978 96% 18,956,372 (4,204,853) Total Revenues over/(under) Expenditures 469,613 (2,104,105) 825,098 2,929,203 (2,787,475) 3,612,573 YTD Variance Variance
‐ 10 20 30 YTD Actual Prior YTD Actual $ Millions
Revenues Summary
Use of Prior Year Reserves Other Financing Sources Miscellaneous Revenue Contributions & Donations from Private Sources Investment Income Fines & Forfeitures Other Charges for Services Intergovernmental Revenues Licenses & Permits Taxes
City Council , 1% City Manager , 1% City Clerk , 1% Legal , 1% Finance and Administration , 12% Information Technology , 3% Marketing , 2% Municipal Court , 1% Police , 24% E‐911 , 0% Public Works , 12% Parks & Recreation , 22% Community Development , 15% Economic Development , 5% Contingency , 0% Other, 7%
Expenditure Summary
YTD Actual
SLIDE 2 City of Dunwoody
YTD Statement of Revenues and Expenses Through October 31, 2015
Revenues
Total Annual Budget YTD Budget YTD Actual Prior YTD Actual Flux ($ '000) (% of YTD Budget) (Diff from Prior Year) Real Property Tax 5,530,000 3,820,000 3,493,841 (326) 91% 3,447,939 45,902 Personal Property Tax 400,000 250,000 334,725 85 134% 344,139 (9,413) Motor Vehicle 560,000 466,667 475,983 9 102% 516,606 40,623 Intangibles (Reg & Recording) 60,000 50,000 126,896 77 254% 78,129 48,767 Franchise Fees 3,500,000 790,000 700,466 (90) 89% 942,383 (241,917) Hotel/Motel Tax 1,380,000 1,150,000 1,332,283 182 116% 1,260,271 72,013 Alcoholic Beverage Excise Tax 650,000 541,667 511,641 (30) 94% 532,420 (20,779) MVR Excise Tax 100,000 83,333 87,783 4 105% 95,942 (8,159) Excise Tax on Energy
32,786 4,037 Business & Occupation Tax 2,750,000 2,710,000 2,534,702 (175) 94% 2,570,531 (35,829) Insurance Premium Tax 2,400,000 2,400,000 2,665,983 266 111% 2,495,238 170,744 Financial Institutions Tax 110,000 110,000 103,210 (7) 94% 113,441 (10,230) Penalties & int on delinq taxe 5,000 4,167 847 (3) 20% 8,277 (7,430) Pen & Int on delinq taxes-Business 20,000 16,667 19,584 3 118% 11,934 7,650 Taxes 17,465,000 12,392,500 12,424,767 32 100% 12,450,037 (25,270) Alcoholic Beverage Licenses 425,000 - 95,557 96 112,068 (16,511) Other Licenses and Permits
3,015 10,195 Planning & Zoning Fees 15,000 12,500 18,917 6 151% 24,570 (5,653) Bldg Structures & Equipment 2,030,005 1,691,671 3,096,463 1,405 183% 983,249 2,113,214 Soil Erosion
20,412 95,664 Plan Review-Fire
52,650 (6,279) Licenses & Permits 2,470,005 1,704,171 3,386,593 1,682 199% 1,195,963 2,190,630 Local Government Grants 4,000,000 4,000,000 4,000,000 - 100% 3,000 3,997,000 Intergovernmental Revenues 4,000,000 4,000,000 4,000,000 - 100% 3,000 3,997,000 Sale of maps and publications
311 (311) Special Police Services 10,000 8,330 16,005 8 192% 14,470 1,535 Fingerprinting Fee 5,000 4,170 5,456 1 131% 7,844 (2,388) Public Safety-Other 36,000 30,000 84,231 54 281% 89,695 (5,464) Special Assessments 20,000 10,000 15,098 5 151% 13,594 1,504 Streetlight Fees 327,000 203,500 217,657 14 107% 198,949 18,708 Recreation Program Fees
249 14,959 Pavilion Rentals 10,000 8,333 16,350 8 196% 13,375 2,975 NSF Fees
90 204 Other Charges for Services 408,000 264,333 374,020 110 141% 338,577 35,443 Municipal Court Fines & Forfeitures 1,500,000 1,245,000 1,066,808 (178) 86% 1,240,588 (173,780) Fines & Forfeitures 1,500,000 1,245,000 1,066,808 (178) 86% 1,240,588 (173,780) Interest Revenue 20,000 16,667 3,480 (13) 21% 4,006 (525) Investment Income 20,000 16,667 3,480 (13) 21% 4,006 (525) Contr & Don From Priv Sources 10,000 10,000 11,050 1 111% 45,851 (34,801) Explorer Donations 5,000 250 8,634 8 3454% 8,845 (211) Donations 4,935 4,935 3,935 (1) 80% - 3,935 Contributions & Donations from Private Sources 19,935 15,185 23,619 8 156% 54,696 (31,077) Rents & Royalties 198,000 165,000 208,300 43 126% 195,620 (12,679) Reimb for damaged property
35,333 (28,219) Other Charges For Services 15,000 12,500 782 (12) 6% 327 455 Miscellaneous Revenue
750 218,585 Miscellaneous Revenue 213,000 177,500 435,530 258 245% 232,030 203,500 Proceeds from sale of property 1,150,000 1,150,000 1,045,490 (105) 91% 650,000 395,490 Other Financing Sources 1,150,000 1,150,000 1,051,407 (99) 91% 650,000 401,407 Use of Prior Year Reserves 1,240,099 1,070,099 1,220,099 150 114% - 1,220,099 Total Revenues 28,486,039 22,035,455 23,986,324 1,951 109% 16,168,897 7,817,426 Variance
SLIDE 3 City of Dunwoody
YTD Statement of Revenues and Expenses Through October 31, 2015
City Council
Total Annual Budget YTD Budget YTD Actual Prior YTD Actual Flux ($ '000) (% of YTD Budget) (Diff from Prior Year) Personnel Services 142,966 119,138 113,752 5 95% 113,235 (516) Purchased/ Contracted Services 80,850 74,264 67,347 7 91% 59,838 (7,509) Supplies and Materials 13,500 11,317 6,056 5 54% 7,026 969 Total City Council 237,316 204,719 187,155 18 91% 180,098 (7,056)
City Council
Total Annual Budget YTD Budget YTD Actual Prior YTD Actual Flux ($ '000) (% of YTD Budget) (Diff from Prior Year) Regular Salaries 88,000 73,333 71,333 2 97% 73,399 2,066 Group Insurance 48,234 40,195 37,152 3 92% 34,618 (2,534) Social Security 5,456 4,547 4,093 0 90% 4,229 136 Medicare 1,276 1,063 957 0 90% 989 32 Workers' Compensation
Personnel Services 142,966 119,138 113,752 5 95% 113,235 (516) Professional Services 4,000 3,333 2,350 1 71% 1,868 (482) Technical Services 3,500 2,917 - 3 0% 3,000 3,000 Property/Liability Insurance 40,000 40,000 52,422 (12) 131% 42,923 (9,499) Communications 6,500 5,417 1,511 4 28% 1,389 (122) Printing & Binding 3,900 3,250 1,548 2 48% - (1,548) Travel 11,000 9,167 4,194 5 46% 4,760 566 Dues & Fees 4,000 3,333 2,332 1 70% 2,593 261 Education & Training 7,950 6,847 2,990 4 44% 3,305 315 Purchased/ Contracted Services 80,850 74,264 67,347 7 91% 59,838 (7,509) Supplies 4,000 3,333 2,219 1 67% 3,251 1,033 Food 4,800 4,067 1,860 2 46% 1,951 91 Books & Periodicals 700 583 - 1 0% 220 220 Small Equipment 4,000 3,333 1,977 1 59% 1,604 (374) Supplies and Materials 13,500 11,317 6,056 5 54% 7,026 969 Total City Council 237,316 204,719 187,155 18 91% 180,098 (7,056) Variance Variance
‐ 50 100 150 200 YTD Actual Prior YTD Actual $ Thousands Supplies and Materials Purchased/ Contracted Services Personnel Services Personnel Services 54% Purchased/ Contracted Services 42% Supplies and Materials 4% YTD Actual
SLIDE 4 City of Dunwoody
YTD Statement of Revenues and Expenses Through October 31, 2015
City Council
Davis Shortal Tallmadge Nall Riticher Deutsch Thompson Heneghan Unallocated Total Regular Salaries 13,333 8,000 10,000 10,000 10,000 10,000 10,000 71,333 Group Insurance 6,092 15,384 15,676 37,152 Social Security 827 496 515 620 580 436 620 4,093 Medicare 193 116 120 145 136 102 145 957 Workers' Compensation 31 31 31 31 31 31 31 216 Personnel Services 20,476 8,643
10,796 10,746 26,245 10,796
Professional Services 2,350 2,350 Property/Liability Insurance 52,422 52,422 Communications 380 1,079 52 1,511 Printing & Binding 468 468 612 1,548 Travel 53 1,115 1,119
20 696 4,194 Dues & Fees 455 1,258 120 500 2,332 Education & Training 615 740 1,020 615 2,990 Purchased/ Contracted Services 1,356 2,198 612 3,117 1,020 1,805
56,020 67,347 Supplies 636 25 16 12 120 12 928 468 2,219 Food 413 131 1,316 1,860 Small Equipment 1,977 1,977 Supplies and Materials 3,027 156
12 120 12 928 1,784 6,056 Total City Council 24,858 10,997 612 29,183 11,828 12,671 26,257 12,943 57,805 187,155 Section 2.07 of the Dunwoody Code of Ordinances states, "The mayor shall be provided an annual expense allowance of $5,000.00 and each councilmember shall be provided an annual expense allowance of $3,000.00 for the reimbursement
- f expenses actually and necessarily incurred by the mayor and councilmembers in carrying out their duties as elected officials of the city."
SLIDE 5 City of Dunwoody
YTD Statement of Revenues and Expenses Through October 31, 2015
City Manager
Total Annual Budget YTD Budget YTD Actual Prior YTD Actual Flux ($ '000) (% of YTD Budget) (Diff from Prior Year) Personnel Services 344,886 286,287 232,736 54 81% 186,836 (45,901) Purchased/ Contracted Services 17,210 14,342 10,075 4 70% 24,864 14,789 Supplies and Materials 5,470 4,661 4,544 0 97% 2,063 (2,481) Total City Manager 367,566 305,290 247,355 58 81% 213,763 (33,592)
City Manager
Total Annual Budget YTD Budget YTD Actual Prior YTD Actual Flux ($ '000) (% of YTD Budget) (Diff from Prior Year) Regular Salaries 257,479 213,302 179,519 34 84% 154,180 (25,340) Group Insurance 41,971 34,976 20,701 14 59% 12,355 (8,346) Medicare 3,661 3,051 2,682 0 88% 1,844 (839) Retirement 40,902 34,085 29,180 5 86% 18,200 (10,980) Workers' Compensation 873 873 655 0 75% 258 (397) Personnel Services 344,886 286,287 232,736 54 81% 186,836 (45,901) Technical Services
Repairs & Maintenance
Communications 3,110 2,592 1,580 1 61% 1,847 267 Printing & Binding 625 521 1,039 (1) 200% 788 (251) Travel 5,500 4,583 964 4 21% 3,003 2,040 Dues & Fees 2,875 2,396 2,393 0 100% 1,469 (924) Education & Training 5,100 4,250 3,503 1 82% 3,998 495 Purchased/ Contracted Services 17,210 14,342 10,075 4 70% 24,864 14,789 Supplies 3,200 2,769 3,313 (1) 120% 919 (2,394) Food 1,500 1,250 753 0 60% 477 (276) Books & Periodicals 320 267 278 (0) 104% 353 75 Small Equipment 450 375 200 0 53% 314 114 Supplies and Materials 5,470 4,661 4,544 0 97% 2,063 (2,481) Total City Manager 367,566 305,290 247,355 58 81% 213,763 (33,592) Variance Variance
Personnel Services 94% Purchased/ Contracted Services 4% Supplies and Materials 2% YTD Actual ‐ 50 100 150 200 250 YTD Actual Prior YTD Actual $ Thousands Supplies and Materials Purchased/ Contracted Services Personnel Services
SLIDE 6 City of Dunwoody
YTD Statement of Revenues and Expenses Through October 31, 2015
City Clerk
Total Annual Budget YTD Budget YTD Actual Prior YTD Actual Flux ($ '000) (% of YTD Budget) (Diff from Prior Year) Personnel Services 131,638 110,051 112,279 (2) 102% 98,950 (13,329) Purchased/ Contracted Services 96,640 84,320 41,094 43 49% 28,292 (12,801) Supplies and Materials 19,500 16,250 3,330 13 20% 1,483 (1,848) Total City Clerk 247,778 210,621 156,703 54 74% 128,725 (27,977)
City Clerk
Total Annual Budget YTD Budget YTD Actual Prior YTD Actual Flux ($ '000) (% of YTD Budget) (Diff from Prior Year) Salaries 99,791 83,486 86,198 (3) 103% 74,657 (11,541) Group Insurance 15,313 12,761 11,770 1 92% 11,209 (562) Medicare 1,346 1,122 1,208 (0) 108% 1,065 (143) Retirement 15,033 12,528 12,875 (0) 103% 11,841 (1,034) Workers' Compensation 155 155 228 (0) 147% 179 (49) Personnel Services 131,638 110,051 112,279 (2) 102% 98,950 (13,329) Professional Services 60,000 50,000 14,117 36 28% 2,283 (11,833) Technical Services 800 667 - 1 0% 400 400 Repairs and Maintenance 23,800 23,230 19,801 3 85% 20,556 755 Communications 2,040 1,700 1,052 1 62% 1,092 40 Advertising 2,000 1,667 1,098 1 66% - (1,098) Printing & Binding 500 417 860 (0) 206% - (860) Travel 3,750 3,515 2,691 1 77% 3,003 312 Dues & Fees 267 223 270 (0) 121% 358 88 Education & Training 3,483 2,903 1,205 2 42% 600 (605) Purchased/ Contracted Services 96,640 84,320 41,094 43 49% 28,292 (12,801) Supplies 1,700 1,417 414 1 29% 1,063 649 Food 400 333 164 0 49% 142 (22) Books & Periodicals 400 333 - 0 0% 278 278 Small Equipment 17,000 14,167 2,752 11 19% - (2,752) Supplies and Materials 19,500 16,250 3,330 13 20% 1,483 (1,848) Total City Clerk 247,778 210,621 156,703 54 74% 128,725 (27,977) Variance Variance
Personnel Services 72% Purchased/ Contracted Services 26% Supplies and Materials 2% YTD Actual ‐ 20 40 60 80 100 120 140 160 YTD Actual Prior YTD Actual $ Thousands Supplies and Materials Purchased/ Contracted Services Personnel Services
SLIDE 7 City of Dunwoody
YTD Statement of Revenues and Expenses Through October 31, 2015
Legal
Total Annual Budget YTD Budget YTD Actual Prior YTD Actual Flux ($ '000) (% of YTD Budget) (Diff from Prior Year) Purchased/ Contracted Services 385,000 330,833 234,029 97 71% 274,249 40,220 Supplies and Materials
317 210 Total Legal 385,000 330,833 234,136 97 71% 274,566 40,430
Legal
Total Annual Budget YTD Budget YTD Actual Prior YTD Actual Flux ($ '000) (% of YTD Budget) (Diff from Prior Year) Professional Services 385,000 330,833 233,909 97 71% 274,227 40,318 Communications
9 (101) Travel
13 3 Purchased/ Contracted Services 385,000 330,833 234,029 97 71% 274,249 40,220 Supplies
300 193 Food
17 17 Supplies and Materials
317 210 Total Legal 385,000 330,833 234,136 97 71% 274,566 40,430 Variance Variance
Purchased/ Contracted Services 100% Supplies and Materials 0% YTD Actual 210 220 230 240 250 260 270 280 YTD Actual Prior YTD Actual $ Thousands Supplies and Materials Purchased/ Contracted Services
SLIDE 8 City of Dunwoody
YTD Statement of Revenues and Expenses Through October 31, 2015
Finance and Administration
Total Annual Budget YTD Budget YTD Actual Prior YTD Actual Flux ($ '000) (% of YTD Budget) (Diff from Prior Year) Personnel Services 212,938 177,350 200,423 (23) 113% 154,201 (46,223) Purchased/ Contracted Services 2,401,425 2,026,686 1,828,494 198 90% 1,703,132 (125,362) Supplies 79,190 66,881 41,444 25 62% 42,311 867 Transfers Out 790,000 727,500 727,500 - 100% 211,125 (516,375) Total Finance and Administration 3,483,553 2,998,417 2,797,862 201 93% 2,110,769 (687,093)
Finance and Administration
Total Annual Budget YTD Budget YTD Actual Prior YTD Actual Flux ($ '000) (% of YTD Budget) (Diff from Prior Year) Regular Salaries 141,134 117,487 121,708 (4) 104% 112,197 (9,511) Group Insurance 22,109 18,424 16,986 1 92% 16,200 (786) Medicare 2,040 1,700 1,710 (0) 101% 1,532 (178) Retirement
Workers' Compensation 155 155 345 (0) 223% 179 (166) Other Employee Benefits 47,500 39,583 23,645 16 60% 24,093 448 Personnel Services 212,938 177,350 200,423 (23) 113% 154,201 (46,223) Official/Admin Services 1,349,997 1,124,998 1,110,923 14 99% 1,041,664 (69,259) Professional Services 148,916 124,097 54,402 70 44% 52,648 (1,754) Technical Services 40,900 38,417 38,405 0 100% 38,155 (251) Repairs & Maintenance 97,313 82,828 59,899 23 72% 64,786 4,888 Rentals 550,419 458,683 369,742 89 81% 350,986 (18,756) Insurance 55,000 55,000 57,744 (3) 105% 40,005 (17,739) Communications 9,160 7,633 9,177 (2) 120% 5,918 (3,259) Advertising 3,900 3,250 1,219 2 37% 1,219 1 Printing & Binding 8,400 7,000 6,356 1 91% 6,364 8 Travel 5,500 5,250 5,448 (0) 104% 4,719 (729) Dues & Fees 63,920 63,199 62,352 1 99% 63,644 1,292 Education & Training 39,200 32,333 30,231 2 93% 8,967 (21,264) Other Charges 28,800 24,000 22,597 1 94% 24,056 1,459 Purchased/ Contracted Services 2,401,425 2,026,686 1,828,494 198 90% 1,703,132 (125,362) Supplies 15,500 12,917 9,948 3 77% 9,992 45 Electricity 24,000 20,889 18,804 2 90% 18,581 (223) Diesel 10,000 8,333 - 8 0% - - Food 22,290 18,575 6,173 12 33% 9,593 3,420 Books & Periodicals 1,500 1,250 696 1 56% 314 (382) Small Equipment 5,900 4,917 5,823 (1) 118% 3,830 - Supplies 79,190 66,881 41,444 25 62% 42,311 867 Transfers to Capital 790,000 727,500 727,500 - 100% - (516,375) Transfers Out 790,000 727,500 727,500
211,125 (516,375) Total Finance and Administration 3,483,553 2,998,417 2,797,862 201 93% 2,110,769 (687,093) Variance Variance
Personnel Services 10% Purchased/ Contracted Services 88% Supplies 2% YTD Actual ‐ 500 1,000 1,500 2,000 2,500 YTD Actual Prior YTD Actual $ Thousands Supplies Purchased/ Contracted Services Personnel Services
SLIDE 9 City of Dunwoody
YTD Statement of Revenues and Expenses Through October 31, 2015
Information Technology
Total Annual Budget YTD Budget YTD Actual Prior YTD Actual Flux ($ '000) (% of YTD Budget) (Diff from Prior Year) Purchased/ Contracted Services 696,988 583,768 560,519 23 96% 454,440 (106,079) Supplies 63,965 57,526 50,817 7 88% 31,639 (19,179) Transfers Out 105,620 79,215 79,215 - 100% 134,561 55,346 Total Information Technology 866,573 720,509 690,551 30 96% 620,640 (69,911)
Information Technology
Total Annual Budget YTD Budget YTD Actual Prior YTD Actual Flux ($ '000) (% of YTD Budget) (Diff from Prior Year) Official/Admin Svcs 458,082 381,735 359,708 22 94% 258,051 (101,657) Professional Services
40 40 Technical Services 11,000 9,611 10,843 (1) 113% 12,609 1,766 Repairs & Maintenance 165,847 138,206 127,309 11 92% 157,089 29,781 Communications 58,559 51,299 60,003 (9) 117% 26,650 (33,353) Printing & Binding 500 417 - 0 0% - - Education & Training 3,000 2,500 2,656 (0) 106% - (2,656) Purchased/ Contracted Services 696,988 583,768 560,519 23 96% 454,440 (106,079) Supplies 650 542 781 (0) 144% 793 12 Small Equipment 63,315 56,985 50,036 7 88% 30,845 - Supplies 63,965 57,526 50,817 7 88% 31,639 (19,179) Transfers to Capital 105,620 79,215 79,215 - 100% 134,561 55,346 Transfers Out 105,620 79,215 79,215
134,561 55,346 Total Information Technology 866,573 720,509 690,551 30 96% 620,640 (69,911) Variance Variance
Purchased/ Contracted Services 92% Supplies 8% YTD Actual ‐ 100 200 300 400 500 600 700 YTD Actual Prior YTD Actual $ Thousands Supplies Purchased/ Contracted Services
SLIDE 10 City of Dunwoody
YTD Statement of Revenues and Expenses Through October 31, 2015
Marketing
Total Annual Budget YTD Budget YTD Actual Prior YTD Actual Flux ($ '000) (% of YTD Budget) (Diff from Prior Year) Purchased/ Contracted Services 472,494 393,745 341,706 52 87% 368,180 26,474 Supplies 17,800 14,833 5,558 9 37% 5,291 (267) Total Marketing 490,294 408,578 347,264 61 85% 373,472 26,208
Marketing
Total Annual Budget YTD Budget YTD Actual Prior YTD Actual Flux ($ '000) (% of YTD Budget) (Diff from Prior Year) Official/Admin Services 307,954 256,628 250,852 6 98% 249,153 (1,700) Professional Services 60,040 50,033 23,131 27 46% 39,353 16,222 Technical Services 14,000 11,667 4,655 7 40% 11,096 6,441 Communications 7,500 6,250 137 6 2% 167 30 Advertising 55,000 45,833 37,829 8 83% 51,199 13,371 Printing & Binding 25,000 20,833 23,125 (2) 111% 12,588 (10,538) Dues & Fees 3,000 2,500 1,977 1 79% 4,625 2,648 Purchased/ Contracted Services 472,494 393,745 341,706 52 87% 368,180 26,474 Supplies 10,000 8,333 5,234 3 63% 3,717 (1,517) Food 7,000 5,833 324 6 6% 785 462 Books & Periodicals 800 667 - 1 0% - - Small Equipment
789 - Supplies 17,800 14,833 5,558 9 37% 5,291 (267) Total Marketing 490,294 408,578 347,264 61 85% 373,472 26,208 Variance Variance
Purchased/ Contracted Services 98% Supplies 2% YTD Actual 320 330 340 350 360 370 380 YTD Actual Prior YTD Actual $ Thousands Supplies Purchased/ Contracted Services
SLIDE 11 City of Dunwoody
YTD Statement of Revenues and Expenses Through October 31, 2015
Municipal Court
Total Annual Budget YTD Budget YTD Actual Prior YTD Actual Flux ($ '000) (% of YTD Budget) (Diff from Prior Year) Personnel Services 283,092 237,912 164,390 74 69% 190,160 25,770 Purchased/ Contracted Services 311,850 259,875 163,798 96 63% 163,011 (787) Supplies and Materials 14,080 11,733 3,929 8 33% 16,095 12,166 Other Financing Uses
(5) 420 Total Municipal Court 609,022 509,520 331,692 178 65% 369,260 37,569
Municipal Court
Total Annual Budget YTD Budget YTD Actual Prior YTD Actual Flux ($ '000) (% of YTD Budget) (Diff from Prior Year) Regular Salaries 180,442 152,267 117,779 34 77% 134,989 17,210 Overtime Salaries 22,909 19,091 1,863 17 10% 5,865 4,002 Group Insurance 45,684 38,070 22,543 16 59% 25,528 2,985 Medicare 2,747 2,289 1,793 0 78% 1,979 186 Retirement 30,690 25,575 19,946 6 78% 21,261 1,316 Workers' Compensation 620 620 465 0 75% 537 72 Personnel Services 283,092 237,912 164,390 74 69% 190,160 25,770 Professional Services 220,230 183,525 110,935 73 60% 120,698 9,763 Technical Services 45,735 38,113 20,177 18 53% 18,266 (1,911) Repairs & Maintenance 17,390 14,492 19,513 (5) 135% 15,522 (3,991) Rentals 4,000 3,333 465 3 14% 505 40 Communications 7,710 6,425 2,483 4 39% 3,020 537 Printing & Binding 1,100 917 1,435 (1) 157% 2,681 1,247 Travel 5,000 4,167 2,595 2 62% 641 (1,953) Dues & Fees 685 571 875 (0) 153% 432 (443) Education & Training 10,000 8,333 5,320 3 64% 1,245 (4,075) Purchased/ Contracted Services 311,850 259,875 163,798 96 63% 163,011 (787) Supplies 5,250 4,375 2,834 2 65% 3,850 1,017 Food 2,300 1,917 673 1 35% 876 203 Books & Periodicals 600 500 - 1 0% 609 609 Small Equipment 5,930 4,942 423 5 9% 10,760 10,337 Supplies and Materials 14,080 11,733 3,929 8 33% 16,095 12,166 Total Municipal Court 609,022 509,520 331,692 178 65% 369,260 37,569 Variance Variance
Personnel Services 50% Purchased/ Contracted Services 49% Supplies and Materials 1% YTD Actual ‐ 50 100 150 200 250 300 350 400 YTD Actual Prior YTD Actual $ Thousands Supplies and Materials Purchased/ Contracted Services Personnel Services
SLIDE 12 City of Dunwoody
YTD Statement of Revenues and Expenses Through October 31, 2015
Police
Total Annual Budget YTD Budget YTD Actual Prior YTD Actual Flux ($ '000) (% of YTD Budget) (Diff from Prior Year) Personnel Services 5,674,887 4,728,250 4,251,027 477 90% 3,911,422 (339,606) Purchased/ Contracted Services 631,388 549,721 491,769 58 89% 509,324 17,555 Supplies and Materials 509,026 448,291 418,387 30 93% 380,273 (38,113) Other Financing Uses 631,500 480,375 480,375 - 100% 63,299 (417,077) Total Police 7,446,801 6,206,636 5,641,558 565 91% 4,864,317 (777,241)
Police
Total Annual Budget YTD Budget YTD Actual Prior YTD Actual Flux ($ '000) (% of YTD Budget) (Diff from Prior Year) Regular Salaries 3,596,581 2,962,865 2,836,895 126 96% 2,647,511 (189,384) Overtime Salaries 352,040 293,367 95,004 198 32% 84,967 (10,038) Total Salaries 3,948,621 3,256,232 2,931,899 324 90% 2,732,478 (199,421) Group Insurance 868,242 723,535 692,552 31 96% 600,081 (92,471) Medicare 57,256 47,713 42,567 5 89% 38,101 (4,465) Retirement 599,990 499,992 460,195 40 92% 411,255 (48,940) Workers' Compensation 200,778 200,778 123,814 77 62% 129,506 5,692 Personnel Services 1,726,266 1,472,018 1,319,128 153 90% 1,178,943 (140,185) Professional Services 17,000 14,167 10,249 4 72% 10,132 (117) Technical Services 46,840 39,033 46,354 (7) 119% 20,791 (25,563) Repairs & Maintenance 283,495 239,103 160,769 78 67% 229,645 68,877 Rentals 15,700 13,083 14,800 (2) 113% 8,815 (5,985) Insurance 100,909 100,909 103,129 (2) 102% 78,592 (24,536) Claims
27,031 19,396 Communications 61,800 55,389 72,684 (17) 131% 74,551 1,866 Advertising 2,500 2,083 1,045 1 50% 613 (432) Printing & Binding 6,160 5,133 2,924 2 57% 3,658 733 Travel 39,000 32,500 37,070 (5) 114% 28,574 (8,496) Dues & Fees 18,799 15,666 7,447 8 48% 5,427 (2,020) Education & Training 39,185 32,654 27,663 5 85% 21,494 (6,169) Purchased/ Contracted Services 631,388 549,721 491,769 58 89% 509,324 17,555 Supplies 102,950 85,792 100,038 (14) 117% 82,876 (17,162) Supplies-Explorer Program 6,000 5,000 15,397 (10) 308% 17,377 1,980 Gasoline 225,000 187,500 134,268 53 72% 201,267 66,999 Food 6,000 5,000 2,200 3 44% 1,394 (805) Books & Periodicals 2,500 2,083 426 2 20% 1,321 895 Small Equipment 166,576 162,916 166,058 (3) 102% 76,038 (90,020) Supplies and Materials 509,026 448,291 418,387 30 93% 380,273 (38,113) Transfers to Capital Fund 631,500 480,375 480,375 - 100% 63,299 (417,077) Other Financing Uses 631,500 480,375 480,375
63,299 (417,077) Total Police 7,446,801 6,206,636 5,641,558 565 91% 4,864,317 (777,241) Variance Variance
Personnel Services 75% Purchased/ Contracted Services 9% Supplies and Materials 7% Other Financing Uses 9% YTD Actual ‐ 1,000 2,000 3,000 4,000 5,000 6,000 YTD Actual Prior YTD Actual $ Thousands Other Financing Uses Supplies and Materials Purchased/ Contracted Services Personnel Services
SLIDE 13 City of Dunwoody
YTD Statement of Revenues and Expenses Through October 31, 2015
E-911
Total Annual Budget YTD Budget YTD Actual Prior YTD Actual Flux ($ '000) (% of YTD Budget) (Diff from Prior Year) Transfers to E-911 Fund 73,300 71,083 13,345 58 19% - (13,345) Total E-911 73,300 71,083 13,345 58 19%
Variance
SLIDE 14 City of Dunwoody
YTD Statement of Revenues and Expenses Through October 31, 2015
Public Works
Total Annual Budget YTD Budget YTD Actual Prior YTD Actual Flux ($ '000) (% of YTD Budget) (Diff from Prior Year) Personnel Services 160,034 135,087 135,876 (1) 101% 126,320 (9,555) Purchased/ Contracted Services 1,429,955 1,191,629 1,053,298 138 88% 1,110,316 57,017 Supplies and Materials 546,450 455,375 447,578 8 98% 455,927 8,349 Transfers to Capital Fund 1,485,000 1,198,750 1,198,750 - 100% 3,063,750 1,865,000 Total Public Works 3,621,439 2,980,842 2,835,502 145 95% 4,756,313 1,920,811
Public Works
Total Annual Budget YTD Budget YTD Actual Prior YTD Actual Flux ($ '000) (% of YTD Budget) (Diff from Prior Year) Salaries 117,821 99,884 99,665 0 100% 94,073 (5,592) Group Insurance 21,342 17,785 16,724 1 94% 15,951 (773) Medicare 1,702 1,418 1,429 (0) 101% 1,315 (114) Retirement 19,014 15,845 16,038 (0) 101% 14,803 (1,235) Workers' Compensation 155 155 2,020 (2) 1303% 179 (1,841) Personnel Services 160,034 135,087 135,876 (1) 101% 126,320 (9,555) Official/Admin Svcs 225,000 187,500 187,499 0 100% 212,500 25,001 Professional Services 120,000 100,000 56,124 44 56% 68,503 12,379 Tree Fund Expenses 93,000 77,500 55,690 22 72% 96,415 40,725 Professional Services
Technical Services 2,400 2,000 1,800 0 90% 2,000 200 Repairs & Maintenance 23,300 19,417 10,000 9 52% 12,733 2,733 R&M - Storm Damage Removal 40,000 33,333 1,750 32 5% 71,544 69,794 R&M - Street Maintenance 671,000 559,167 589,698 (31) 105% 455,665 (134,033) R&M - Traffic Signals 196,000 163,333 112,577 51 69% 156,466 43,889 R&M - Right of Way Maint 45,000 37,500 27,790 10 74% 29,750 1,960 Claims 1,000 833 4,764 (4) 551% - (4,764) Communications 1,700 1,417 2,627 (1) 185% 2,029 (598) Advertising 2,500 2,083 - 2 0% 979 979 Printing & Binding 1,500 1,250 1,105 0 88% - (1,105) Travel 4,280 3,567 396 3 11% 471 75 Purchased/ Contracted Services 1,429,955 1,191,629 1,053,298 138 88% 1,110,316 57,017 Supplies-Office 1,200 1,000 944 0 94% 596 (349) Supplies-Road Materials 60,000 50,000 55,075 (5) 110% 79,638 24,563 Electricity 485,000 404,167 388,104 16 96% 375,693 (12,411) Small Equipment
Supplies and Materials 546,450 455,375 447,578 8 98% 455,927 8,349 Transfers to Capital Fund 1,485,000 1,198,750 1,198,750 - 100% 3,063,750 1,865,000 Transfers to Capital Fund 1,485,000 1,198,750 1,198,750
Total Public Works 3,621,439 2,980,842 2,835,502 145 95% 4,756,313 1,920,811 Variance Variance
‐ 1,000 2,000 3,000 4,000 5,000 YTD Actual Prior YTD Actual $ Thousands Transfers to Capital Fund Supplies and Materials Purchased/ Contracted Services Personnel Services Personnel Services 8% Purchased/ Contracted Services 65% Supplies and Materials 27% YTD Actual
SLIDE 15 City of Dunwoody
YTD Statement of Revenues and Expenses Through October 31, 2015
Parks and Recreation
Total Annual Budget YTD Budget YTD Actual Prior YTD Actual Flux ($ '000) (% of YTD Budget) (Diff from Prior Year) Purchased/ Contracted Services 1,408,800 1,313,124 880,997 432 67% 559,174 (321,823) Supplies and Materials 277,000 237,500 252,772 (15) 106% 266,500 13,728 Transfers Out 3,933,367 3,834,056 3,834,056 0 100% 1,159,055 (2,675,001) Total Parks and Recreation 5,619,167 5,384,680 4,967,825 417 92% 1,984,729 (2,983,096)
Parks and Recreation
Total Annual Budget YTD Budget YTD Actual Prior YTD Actual Flux ($ '000) (% of YTD Budget) (Diff from Prior Year) Official/Admin Svcs 202,800 169,000 169,000 - 100% 104,167 (64,834) Professional Services 510,000 509,250 14,336 495 3% 9,012 (5,324) Technical Services
R&M-Parks 660,000 599,524 666,490 (67) 111% 417,041 (249,449) Rentals 2,000 1,667 - 2 0% - - Property/Liability Insurance 32,100 32,100 26,862 5 84% 28,955 2,093 Claims
1,000 - Communications 1,500 1,250 909 0 73% 947 38 Dues & Fees 400 333 - 0 0% 110 110 Purchased/ Contracted Services 1,408,800 1,313,124 880,997 432 67% 559,174 (321,823) Supplies 102,000 91,667 106,390 (15) 116% 117,570 11,180 Utilities 168,000 140,000 141,345 (1) 101% 148,930 7,586 Food
Supplies and Materials 277,000 237,500 252,772 (15) 106% 266,500 13,728 Transfers to Debt Service Fund 108,367 90,306 90,306 0 100% 90,305 (1) Transfers to Capital Fund 3,825,000 3,743,750 3,743,750 - 100% 1,068,750 (2,675,000) Transfers Out 3,933,367 3,834,056 3,834,056 0 100% 1,159,055 (2,675,001) Total Parks and Recreation 5,619,167 5,384,680 4,967,825 417 92% 1,984,729 (2,983,096) Variance Variance
Purchased/ Contracted Services 18% Supplies and Materials 5% Transfers Out 77% YTD Actual ‐ 1,000 2,000 3,000 4,000 5,000 YTD Actual Prior YTD Actual $ Thousands Transfers Out Supplies and Materials Purchased/ Contracted Services
SLIDE 16 City of Dunwoody
YTD Statement of Revenues and Expenses Through October 31, 2015
Community Development
Total Annual Budget YTD Budget YTD Actual Prior YTD Actual Flux ($ '000) (% of YTD Budget) (Diff from Prior Year) Purchased/ Contracted Services 2,641,344 2,201,120 3,446,276 (1,245) 157% 1,834,565 (1,611,710) Supplies and Materials 15,800 13,532 14,392 (1) 106% 11,006 (3,386) Transfers Out
9,750 9,750 Total Community Development 2,657,144 2,214,652 3,460,667 (1,246) 156% 1,855,321 (1,605,346)
Community Development
Total Annual Budget YTD Budget YTD Actual Prior YTD Actual Flux ($ '000) (% of YTD Budget) (Diff from Prior Year) Official/Admin Svcs 1,937,000 1,614,167 3,146,786 (1,533) 195% 1,753,869 (1,392,918) Professional Services 447,945 373,288 201,725 172 54% 24,120 (177,604) Technical Services 124,602 103,835 61,321 43 59% 34,747 (26,574) Repairs & Maintenance 101,397 84,498 14,957 70 18% 3,456 (11,501) Rentals
Communications 4,500 3,750 1,887 2 50% 8,919 7,032 Advertising 15,000 12,500 9,925 3 79% 4,344 (5,580) Printing & Binding 5,000 4,167 1,100 3 26% 67 (1,034) Travel 1,000 833 23 1 3% 250 227 Dues & Fees 1,900 1,583 280 1 18% 2,975 2,695 Education & Training 3,000 2,500 1,295 1 52% - (1,295) Purchased/ Contracted Services 2,641,344 2,201,120 3,446,276 (1,245) 157% 1,834,565 (1,611,710) Supplies 11,500 9,583 8,785 1 92% 10,857 2,072 Food 1,000 890 1,513 (1) 170% 90 (1,423) Books & Periodicals 1,000 833 1,017 (0) 122% 59 (958) Small Equipment 2,300 2,225 3,077 (1) 138% - (3,077) Supplies and Materials 15,800 13,532 14,392 (1) 106% 11,006 (3,386) Transfers to Capital Fund
9,750 9,750 Transfers Out
9,750 9,750 Total Community Development 2,657,144 2,214,652 3,460,667 (1,246) 156% 1,855,321 (1,605,346) Variance Variance
Purchased/ Contracted Services 100% Supplies and Materials 0% YTD Actual ‐ 500 1,000 1,500 2,000 2,500 3,000 3,500 YTD Actual Prior YTD Actual $ Thousands Transfers Out Supplies and Materials Purchased/ Contracted Services
SLIDE 17 City of Dunwoody
YTD Statement of Revenues and Expenses Through October 31, 2015
Economic Development
Total Annual Budget YTD Budget YTD Actual Prior YTD Actual Flux ($ '000) (% of YTD Budget) (Diff from Prior Year) Purchased/ Contracted Services 91,468 76,509 55,642 21 73% 51,069 (4,573) Supplies and Materials 64,005 53,338 63,968 (11) 120% 1,663 (62,306) Transfers Out 1,356,000 1,130,000 1,130,000 - 100% 1,171,667 41,667 Total Economic Development 1,511,473 1,259,847 1,249,611 10 99% 1,224,399 (25,212)
Economic Development
Total Annual Budget YTD Budget YTD Actual Prior YTD Actual Flux ($ '000) (% of YTD Budget) (Diff from Prior Year) Professional Services 40,000 33,333 25,500 8 77% 25,000 (500) Technical Services 7,800 6,500 - 7 0% - - Communications 968 807 6 1 1% - (6) Advertising 34,200 28,500 25,655 3 90% 22,325 (3,330) Printing & Binding 3,500 2,917 - 3 0% 394 394 Travel 1,500 1,250 430 1 34% 49 (381) Dues & Fees 3,500 3,202 4,051 (1) 126% 2,606 (1,445) Education & Training
695 695 Purchased/ Contracted Services 91,468 76,509 55,642 21 73% 51,069 (4,573) Supplies
1,663 1,663 Utilities 62,505 52,088 62,505 (10) 120% - (62,505) Food 1,500 1,250 1,069 0 86% - (1,069) Small Equipment
Supplies and Materials 64,005 53,338 63,968 (11) 120% 1,663 (62,306) Transfers to Debt Service Fund 1,356,000 1,130,000 1,130,000 - 100% 1,171,667 41,667 Transfers Out 1,356,000 1,130,000 1,130,000
Total Economic Development 1,511,473 1,259,847 1,249,611 10 99% 1,224,399 (25,212)
Contingency
Total Annual Budget YTD Budget YTD Actual Prior YTD Actual Flux ($ '000) (% of YTD Budget) (Diff from Prior Year) Contingency 400,000 333,333 - 333 0% - - Total Contingency 400,000 333,333
0%
Total General Fund Expenditures 28,016,426 24,139,560 23,161,226 978 96% 18,956,372 (4,204,853) Total Revenues over/(under) Expenditures 469,613 (2,604,105) 825,098 3,429
3,612,573 Variance Variance Variance
Purchased/ Contracted Services 5% Supplies and Materials 5% Transfers Out 90% YTD Actual ‐ 200 400 600 800 1,000 1,200 1,400 YTD Actual Prior YTD Actual $ Thousands Transfers Out Supplies and Materials Purchased/ Contracted Services
SLIDE 18 City of Dunwoody YTD Statement of Revenues and Expenses Through October 31, 2015
E911 Fund
Total Annual Budget YTD Budget YTD Actual Prior YTD Actual Flux
($ '000) (% of YTD Budget) (Diff from Prior Year)
Revenues
E911 Revenue 1,200,000 975,000 990,345 15 102% 1,069,657 79,312 Transfers In 73,300 61,083 13,345 (48) 22%
Total Revenues 1,273,300 1,036,083 1,003,690 (32) 97% 1,069,657 65,967
Expenditures
Communications 148,300 123,583 64,964 59 53% 145,910 80,946 Intergovernmental-E911 (Chatcomm) 1,125,000 937,500 937,500 - 100% 993,750 56,250 Total Expenditures 1,273,300 1,061,083 1,003,690 57 95% 1,139,660 135,970 Total Revenues over/(under) Expenditures
0% (70,003) (70,003) Variance
SLIDE 19 City of Dunwoody YTD Statement of Revenues and Expenses Through October 31, 2015
Hotel Excise Tax Fund
Total Annual Budget YTD Budget YTD Actual Prior YTD Actual Flux
($ '000) (% of YTD Budget) (Difference from Prior Year)
Revenues
Hotel/Motel Tax 2,300,000 1,916,667 2,220,452 304 116% 2,100,423 (120,029) Interest Revenue
21 8 Total Revenues 2,300,000 1,916,667 2,220,465 304 116% 2,100,444 (120,021)
Expenditures
Transfers to General Fund 1,380,000 1,150,000 1,332,283 (182) 116% 1,260,271 (72,013) Transfers to Component Unit - CVBD 920,000 766,667 888,181 (122) 116% 840,169 (48,012) Total Expenditures 2,300,000 1,916,667 2,220,464 (304) 116% 2,100,440 (120,025) Total Revenues over/(under) Expenditures
4 3 Variance
SLIDE 20 City of Dunwoody YTD Statement of Revenues and Expenses Through October 31, 2015
Motor Vehicle Rental Excise Tax Fund
Total Annual Budget YTD Budget YTD Actual Prior YTD Actual Flux
($ '000) (% of YTD Budget) (Difference from Prior Year)
Revenues
MV Rental Excise Tax 100,000 83,333 87,783 4 105% 95,942 8,159 Total Revenues 100,000 83,333 87,783 4 105% 95,942 8,159
Expenditures
Transfers to General Fund 100,000 83,333 87,783 (4) 105% 95,942 8,159 Total Expenditures 100,000 83,333 87,783 (4) 105% 95,942 8,159 Total Revenues over/(under) Expenditures
SLIDE 21 City of Dunwoody YTD Statement of Revenues and Expenses Through October 31, 2015
HOST Fund
Total Annual Budget YTD Budget YTD Actual Prior YTD Actual Flux
($ '000) (% of YTD Budget) (Difference from Prior Year)
Revenues
Homestead Option Sales Tax 5,300,000 3,960,000 2,843,835 (1,116) 72% 4,140,918 1,297,083 Interest Revenue 4,500 3,750 1,832 (2) 49% 1,918 87 Total Revenues 5,304,500 3,963,750 2,845,667 (1,118) 72% 4,142,836 5,597,083
Expenditures
Transfers Out - Capital (PW) 5,300,000 4,300,000 4,300,000 - 100%
Transfers Out - Capital (PK)
Total Expenditures 5,300,000 4,300,000 4,300,000 - 100% - (4,300,000) Total Revenues over/(under) Expenditures 4,500 (336,250) (1,454,333) (1,118) 433% 4,142,836 5,597,083 Variance
SLIDE 22 City of Dunwoody YTD Statement of Expenses Through October 31, 2015
Capital Projects Fund
Original Budget Adjustments/ Amendments Total Project Budget Spent in Prior Years Spent in Current Year Total Spent to Date Project Balance
Expenditures
Courtroom and Council AV 140,400 - 140,400 (127,191) (4,714) (131,905) 8,495 Website Redesign and Replacement COMPLETED 2015 65,000 - 65,000 (55,854) (12,831) (68,685) (3,685) Data Center Power Protection 25,620 - 25,620 - (911) (911) 24,709 Physical Access and Video Control Management System 50,000 - 50,000 - - - 50,000 Unified Threat Management System 30,000 - 30,000 - (35,792) (35,792) (5,792) Information Technology 311,020 - 311,020 (183,045) (54,249) (237,294) 73,726 City Hall Design & Engineering Prefunding 100,000 500,000 600,000 - - - 600,000 Programming Study for Future City Hall 50,000 - 50,000 (1,200) (50,345) (51,545) (1,545) City Hall Reconfiguration for Efficiency 31,500 40,000 71,500 (17,084) (24,733) (41,817) 29,683 Facilities Improvement Partnership Program (2015 FIPP) 250,000 - 250,000 - (22,941) (22,941) 227,059 Facilities 181,500 551,918 733,418 57,092 64,686 121,778 855,197 Fixed LPR & Mobile LPR 119,875 - 119,875 (49,459)
Code Red 24,500 - 24,500 (18,875)
Vehicle Replacement 2,000,000 59,026 2,059,026 (483,284) (741,061) (1,224,345) 834,681 Daily Report Software 12,400 - 12,400 - - - 12,400 Surveillance System 113,000 180,375 293,375 (198,362) (18,089) (216,451) 76,924 New Position-Detective Machinery & Equipment 30,000 - 30,000 (26,057)
AFIS Automated Fingerprint Identification System 54,398 - 54,398 - (48,325) (48,325) 6,073 Gated Community Access Controls
- 40,000 40,000 - (25,523) (25,523) 14,477
Police Department 2,354,173 279,401 2,633,574 (776,037) (832,998) (1,609,035) 1,024,539 Dunwoody Village TE Project 2,100,000 (525,103) 1,574,897 (1,127,854) (35,982) (1,163,836) 411,061 Road Resurfacing 10,631,000 83,697 10,714,697 (7,051,103) (1,827,249) (8,878,352) 1,836,345 New Sidewalks and ADA Ramps 2,970,000 75,000 3,045,000 (1,891,063) (742,067) (2,633,130) 411,870 Traffic Calming Radar Signs 100,000 - 100,000 (11,650)
- (11,650) 88,350
- N. Peachtree Rd/Tilly Mill Intersection Improvement
2,850,000 - 2,850,000 (420,330) (180,790) (601,119) 2,248,881
- Mt. Vernon Rd/Vermack Intersection Improvement
325,000 306,000 631,000 (97,451) (54,987) (152,438) 478,562 Womack/Vermack Intersection Improvement 200,000 - 200,000 (69,912)
Wayfinding 150,000 - 150,000 (79,516) (42,178) (121,695) 28,305 Chamblee Dunwoody & Spalding Drive 370,000 55,000 425,000 (102,535) (14,400) (116,935) 308,065 School Pedestrian Safety Improvements
- 40,000 40,000 (37,816) (4,100) (41,916) (1,916)
Concept Funding-Tilly Mill at Mt. Vernon Place 25,000 - 25,000 - (2,500) (2,500) 22,500 Concept Funding-Mt. Vernon at Tilly Mill 25,000 - 25,000 - (5,000) (5,000) 20,000 Concept Funding-Chamblee Dunwoody at Peeler 50,000 - 50,000 - - - 50,000 Citywide Traffic Signal Communications (ITS) 265,000 - 265,000 - (70,709) (70,709) 194,291 Chamblee Dunwoody Rd Bicycle & Pedestrian Imprv (Cambridge to VV) 1,650,000 1,600,000 3,250,000 (51,977) (36,963) (88,940) 3,161,060 Chesnut Elementary Pedestrian Project
- 46,760 46,760 (13,915)
- (13,915) 32,845
Kingsley Safe Routes to School-retaining walls
- 50,000 50,000 (43,439) (8,410) (51,849) (1,849)
Construction Funding Mt. Vernon/Womack Pedestrian Crossing Improvements
- 150,000 150,000 - (45,379) (45,379) 104,621
Chamblee Dunwoody Georgetown Corridor 275,000 150,000 425,000 - (48,834) (48,834) 376,166 Watermain Project with DeKalb (will be reimbursed)
- 316,989 316,989 - (825,402) (825,402) (508,413)
Crosswalk replacement with PCID (will be reimbursed)
- - - - (969,355) (969,355) (969,355)
IGA Doraville Crosswalk
- 40,000 40,000 - - - 40,000
Public Works 21,986,000 2,388,344 24,374,344 (10,998,561) (4,914,305) (15,912,866) 8,461,478 Pernoshal Park 1,025,000 2,225,000 3,250,000 (6,315) (942,164) (948,479) 2,301,521 Brook Run Park Improvements 150,000 126,945 276,945 (111,114) (174,444) (285,559) (8,613) Brook Run Trail 572,010 675,179 1,247,189 (1,129,580) (111,635) (1,241,215) 5,974 Nancy Creek Greenway 25,000 - 25,000 (17,463)
Dunwoody Gateway Market Installation 150,000 - 150,000 (9,618)
Donaldson Chesnut Facility Stabilization 226,000 - 226,000 - (19,915) (19,915) 206,085 Design for Future Parks Trails Projects 25,000 - 25,000 - - - 25,000 Brook Run Dog Park Relocation 195,000 - 195,000 (35,268) (132,677) (167,945) 27,055 Dunwoody Park Parking Lot Resurfacing 100,000 - 100,000 (82,431)
Emergency Notification System for Brook Run Park and Dunwoody Park 85,000 - 85,000 (72,012) (1,003) (73,015) 11,985 Georgetown Park-Shade Structure COMPLETED 2015
- 75,000 75,000 - (65,000) (65,000) 10,000
Georgetown Park-Play Structure
- 25,000 25,000 - - - 25,000
Dunwoody Nature Center Parking Lot Resurfacing 100,000 - 100,000 - (57,948) (57,948) 42,052
- Constr. Dunwoody Renaissance 5 acre Park
- 3,200,000 3,200,000 - - - 3,200,000
- Constr. Great Lawn @ Brook Run
- 300,000 300,000 - - - 300,000
Parks 2,653,010 6,627,124 9,280,134 (1,463,801) (1,504,785) (2,968,587) 6,311,547 Plotter Purchase COMPLETED 2015 20,000 - 20,000 (6,096) (3,048) (9,144) 10,856 Community Development 20,000 - 20,000 (6,096) (3,048) (9,144) 10,856 Total 27,505,703 9,846,787 37,352,490 (13,370,449) (7,244,699) (20,615,147) 16,737,342
SLIDE 23 City of Dunwoody YTD Statement of Revenues and Expenses Through October 31, 2015
Debt Service Fund
Total Annual Budget YTD Budget YTD Actual Prior YTD Actual Flux
($ '000) (% of YTD Budget) (Difference from Prior Year)
Revenues
Transfers from General Fund 1,464,367 1,220,306 1,220,306 (0) 100% 1,261,972 41,666 Total Revenues 1,464,367 1,220,306 1,220,306 (0) 100% 1,261,972 41,666
Expenditures
Lease Principal
1,157,044 1,157,044 Lease Interest
81,604 81,604 Transfers Out - CU 1,464,088 1,385,566 1,411,740 (26) 102% 23,092 (1,388,647) Total Expenditures 1,464,088 1,385,566 1,411,740 (26) 102% 1,261,740 (150,000) Total Revenues over/(under) Expenditures 279 (165,260) (191,434) (26) 116% 232 191,666 Variance
SLIDE 24 City of Dunwoody YTD Statement of Revenues and Expenses Through October 31, 2015
Stormwater fund
Total Annual Budget YTD Budget YTD Actual Prior YTD Actual Flux
($ '000) (% of YTD Budget) (Difference from Prior Year)
Revenues
Stormwater Utility Charges 1,851,622 1,205,444 1,228,581 23 102% 1,183,240 (45,341) Interest Revenue 800 667 482 (0) 72% 1,018 536 Residual Equity Transfer In 269,078 269,078 269,078 - 100%
Total Revenues 2,121,500 1,475,188 1,498,141 23 102% 1,184,258 (313,884)
Expenditures
Official/Admin Svcs 120,000 100,000 83,332 17 83% 100,000 16,668 Professional Services-Stormwater 160,000 133,333 91,091 42 68% 12,594 (78,497) Repairs & Maintenance 1,785,000 1,685,000 728,078 957 42% 1,420,896 692,818 Rep & Maint-Riprap Program 5,000 4,167 4,186 (0) 100%
Printing & Binding 500 417 5 0 1%
Dues & Fees 500 417 500 (0) 120% 431 (69) Purchased/ Contracted Services 2,071,000 1,923,333 907,192 1,016 47% 1,533,922 626,729 Supplies 50,000 41,667 25,537 16 61% 84,014 58,477 Books & Periodicals 500 417 - 0 0%
Supplies and Materials 50,500 42,083 25,537 17 61% 84,014 58,477 Total Expenditures 2,121,500 1,965,417 932,729 1,033 47% 1,617,936 685,207 Total Revenues over/(under) Expenditures
- (490,228) 565,412 1,056
- 115% (433,678)
(999,090) Variance ‐ 200 400 600 800 1,000 1,200 1,400 1,600 1,800
YTD Actual Prior YTD Actual
$ Thousands
Supplies and Materials Purchased/ Contracted Services
Purchased/ Contracted Services 97% Supplies and Materials 3%
Expenditures
YTD Actual
SLIDE 25 Convention Vistors' Bureau of Dunwoody Monthly Statement of Revenues and Expenses October 31, 2015
Variance
CVB of Dunwoody
(% of YTD Budget) Fund Balance
Interest Revenue 1,152 960 1,237 129% 912 Rental Revenue 8,442 7,035 7,377 105%
- Other Revenue
- Tax Revenue
1,033,449 861,208 888,181 103% 840,169 Residual Equity Transfer (Promotional Reserv 20,000 20,000 5,000 25%
1,043,043 869,203 896,795 103% 841,081
Expenditures
Employees/Personnel Salaries 288,757 224,998 233,701 104% 198,419 Benefits 35,554 29,144 25,716 88% 15,416 Payroll Taxes 28,876 22,498 17,804 79% 16,024 Unemployment
Medic
- Total Employees/Personnel Expenditures
353,187 276,640 277,221 100% 229,048 Administrative Depreciation Expense
- Legal & Professional Fees
18,140 17,400 15,242 88% 9,810 Rent 44,047 36,632 41,745 114% 34,596 Employee Development 6,320 6,320 5,798 92% 4,208 Equipment Lease 1,920 1,570 1,835 117% 1,515 IT Support 6,960 5,800 8,029 138% 5,455 Insurance 3,900 700 3,682 526% 3,868 Postage/Courier/Ovenight Mail
798 Telephone/Internet 8,400 7,000 5,906 84% 5,603 Licenses & Fees 3,050 2,550 39 2% 7,190 Miscellaneous 1,200 1,000 447 45% 633 Office Expense 2,400 2,000 9,237 462% 2,439 Vehicle Expenses
3,600 3,300 1,817 55% 2,396 Travel 7,200 6,000 2,930 49% 4,060 Small Equipment 2,000 2,000 9,803 490% 8,950 Furniture & Fixtures 10,000 10,000
- 0%
- Total Administrative Expenditures
119,137 102,272 107,967 106% 91,521 Marketing Research 40,000 40,000 40,154 100% 6,800 Graphic Design 30,800 26,800 22,958 86% 22,175 Public Relations 12,000 12,000 15,351 128% 10,950 Website Management 72,579 71,579 65,270 91% 13,791 Website Marketing 59,000 50,000 39,061 78% 39,989 Advertising - Print 96,000 80,000 80,991 101% 65,374 Advertising - Digital 78,000 65,000 52,974 81% 87,360 Printing 23,800 23,800 9,136 38% 17,372 Postage/Courier/Ovenight Mail 2,400 2,000 9 0% 134 Dues & Subscriptions 9,483 9,265 20,044 216% 2,539 Memberships 12,259 12,259 11,313 92% 12,275 Customer Relationship Management Tool 13,500 13,500 13,500 100% 13,500 Photography 9,000 9,000 4,351 48% 8,050 Miscellaneous 1,800 1,500 83 6% 1,170 Total Marketing Expenditures 460,621 416,703 375,194 90% 301,478 Promotional Community Development
Conventions and Trade Shows 20,569 20,569 23,784 116% 17,844 Event Hosting & Site Visits 24,500 21,800 36,999 170% 3,154 Sponsorships
13,000 Group Sales Show Sponsorships 33,500 33,500
- 0%
- Meals and Business Development
3,600 3,000 4,591 153% 1,917 Meeting Bids and Incentives 10,000 10,000
3,000 Promotions 24,800 23,500 36,269 154% 27,190 Travel 13,200 11,000 11,651 106% 11,717 Promotional Materials 12,000 10,000 18,393 184% 16,700 Total Promotional Expenditures 142,169 133,369 154,287 116% 111,621 Total Expenditures 1,075,114 928,984 914,669 98% 733,668 Total Revenues over/(under) Expenditures (32,071) (59,782) (17,875) 107,413 Prior YTD Actual Total Annual Budget YTD Budget YTD Actual
SLIDE 26
11/16/2015 9:13 AM A/P HISTORY CHECK REPORT PAGE: 1 VENDOR SET: 01 City of Dunwoody, GA BANK: * ALL BANKS DATE RANGE:10/01/2015 THRU 10/31/2015 CHECK CHECK CHECK CHECK VENDOR I.D. NAME STATUS DATE AMOUNT DISCOUNT NO STATUS AMOUNT 1 Todd Feaser VOIDED C-CHECK Todd Feaser VOIDED V 10/02/2015 020198 250.00CR * * T O T A L S * * NO INVOICE AMOUNT DISCOUNTS CHECK AMOUNT REGULAR CHECKS: 0 0.00 0.00 0.00 HAND CHECKS: 0 0.00 0.00 0.00 DRAFTS: 0 0.00 0.00 0.00 EFT: 0 0.00 0.00 0.00 NON CHECKS: 0 0.00 0.00 0.00 VOID CHECKS: 1 VOID DEBITS 0.00 VOID CREDITS 250.00CR 250.00CR 0.00 TOTAL ERRORS: 0 NO INVOICE AMOUNT DISCOUNTS CHECK AMOUNT VENDOR SET: 01 BANK: * TOTALS: 1 250.00CR 0.00 0.00 BANK: * TOTALS: 1 250.00CR 0.00 0.00
SLIDE 27 11/16/2015 9:13 AM A/P HISTORY CHECK REPORT PAGE: 2 VENDOR SET: 01 City of Dunwoody, GA BANK: 01 Suntrust Concentration DATE RANGE:10/01/2015 THRU 10/31/2015 CHECK CHECK CHECK CHECK VENDOR I.D. NAME STATUS DATE AMOUNT DISCOUNT NO STATUS AMOUNT 001145 ETS Corporation I-September 2015 ETS Corporation D 10/01/2015 000000 100 1516.523900.00 Merchant Services ETS Corporation 1,507.93 1,507.93 001615 PNC Bank, N. A. I-Nov 2015 PNC Bank, N. A. D 10/09/2015 000000 405 8000.581200.01 Lease Principal PNC Bank, N. A. 14,614.39 405 8000.582200.01 Lease Interest PNC Bank, N. A. 2,529.05 17,143.44 001615 PNC Bank, N. A. I-November 2015 PNC Bank, N. A. D 10/21/2015 000002 405 8000.581200.01 Lease Principal PNC Bank, N. A. 6,450.91 405 8000.582200.01 Lease Interest PNC Bank, N. A. 2,579.61 9,030.52 001615 PNC Bank, N. A. I-October 2015 (3) PNC Bank, N. A. R 10/02/2015 020121 405 8000.581200.01 Lease Principal PNC Bank, N. A. 1,150,000.00 1,150,000.00 * * T O T A L S * * NO INVOICE AMOUNT DISCOUNTS CHECK AMOUNT REGULAR CHECKS: 1 1,150,000.00 0.00 1,150,000.00 HAND CHECKS: 0 0.00 0.00 0.00 DRAFTS: 3 27,681.89 0.00 27,681.89 EFT: 0 0.00 0.00 0.00 NON CHECKS: 0 0.00 0.00 0.00 VOID CHECKS: 0 VOID DEBITS 0.00 VOID CREDITS 0.00 0.00 0.00 TOTAL ERRORS: 0 ** G/L ACCOUNT TOTALS ** G/L ACCOUNT NAME AMOUNT
- 100 1516.523900.00 Merchant Services 1,507.93
*** FUND TOTAL *** 1,507.93 405 8000.581200.01 Lease Principal 1,171,065.30 405 8000.582200.01 Lease Interest 5,108.66 *** FUND TOTAL *** 1,176,173.96 NO INVOICE AMOUNT DISCOUNTS CHECK AMOUNT VENDOR SET: 01 BANK: 01 TOTALS: 4 1,177,681.89 0.00 1,177,681.89 BANK: 01 TOTALS: 4 1,177,681.89 0.00 1,177,681.89
SLIDE 28
11/16/2015 9:13 AM A/P HISTORY CHECK REPORT PAGE: 3 VENDOR SET: 01 City of Dunwoody, GA BANK: 03 Suntrust Disbursement Acc DATE RANGE:10/01/2015 THRU 10/31/2015 CHECK CHECK CHECK CHECK VENDOR I.D. NAME STATUS DATE AMOUNT DISCOUNT NO STATUS AMOUNT 000022 ADP I-461992182 ADP D 10/09/2015 000000 100 1512.521200.00 Professional Services ADP 541.58 541.58 000022 ADP I-462790180 ADP D 10/23/2015 000000 100 1512.521200.00 Professional Services ADP 570.47 570.47 000022 ADP I-463091078 ADP D 10/30/2015 000000 100 1512.521200.00 Professional Services ADP 25.00 25.00 000025 Clark Patterson Lee I-58 Clark Patterson Lee D 10/26/2015 000000 100 7000.521100.01 Official/Admin Svcs Clark Patterson Lee 132,250.00 132,250.00 000029 Lowe Engineers, LLC I-15743 Lowe Engineers, LLC D 10/31/2015 000000 100 4100.521100.01 Official/Admin Svcs Lowe Engineers, LLC 18,750.00 100 6200.521100.01 Official/Admin Svcs Lowe Engineers, LLC 16,900.00 560 4320.521100.01 Official/Admin Svcs Lowe Engineers, LLC 8,333.17 I-15744 Lowe Engineers, LLC D 10/31/2015 000000 350 4200.522200.00 Repairs & Maintenance Lowe Engineers, LLC 4,910.40 350 4200.541400.00 Infrastructure Lowe Engineers, LLC 5,580.00 350 4200.541400.00 Infrastructure Lowe Engineers, LLC 892.80 350 6200.521200.00 Professional Services Lowe Engineers, LLC 2,790.00 100 4200.521200.00 Prof Services Lowe Engineers, LLC 1,227.60 560 4320.521200.09 Prof Svcs-Stormwater Lowe Engineers, LLC 2,901.60 100 4200.522200.02 R&M - Street Maintenance Lowe Engineers, LLC 1,785.60 I-15745 Lowe Engineers, LLC D 10/31/2015 000000 100 4200.522200.02 R&M - Street Maintenance Lowe Engineers, LLC 300.00 I-15746 Lowe Engineers, LLC D 10/31/2015 000000 560 4320.521200.09 Prof Svcs-Stormwater Lowe Engineers, LLC 2,100.00 I-15758 Lowe Engineers, LLC D 10/31/2015 000000 350 6200.521200.00 Professional Services Lowe Engineers, LLC 355.00 66,826.17 000073 JAT Consulting Services, Inc I-45 JAT Consulting Services, Inc D 10/01/2015 000000 100 1511.521100.01 Official/Admin Svcs JAT Consulting Servi 104,652.39 104,652.39 000094 WEX BANK I-42605398 WEX BANK D 10/06/2015 000000 100 3200.531270.00 Gasoline WEX BANK 1,549.94 1,549.94
SLIDE 29
11/16/2015 9:13 AM A/P HISTORY CHECK REPORT PAGE: 4 VENDOR SET: 01 City of Dunwoody, GA BANK: 03 Suntrust Disbursement Acc DATE RANGE:10/01/2015 THRU 10/31/2015 CHECK CHECK CHECK CHECK VENDOR I.D. NAME STATUS DATE AMOUNT DISCOUNT NO STATUS AMOUNT 000094 WEX BANK I-42743384 WEX BANK D 10/23/2015 000000 100 3200.531270.00 Gasoline WEX BANK 10,763.89 10,763.89 000137 Medcom Services, Inc I-10/10/2015 Medcom Services, Inc D 10/10/2015 000000 100 0000.121300.16 Flex Spending Ded Payable Medcom Services, Inc 122.44 122.44 000137 Medcom Services, Inc I-10/17/2015 Medcom Services, Inc D 10/17/2015 000000 100 0000.121300.16 Flex Spending Ded Payable Medcom Services, Inc 192.30 192.30 000271 Georgia Bureau of Investigatio I-304-256083 Georgia Bureau of Investigatio D 10/01/2015 000000 100 3200.521300.00 Technical Svcs Georgia Bureau of In 1,147.50 1,147.50 001419 Mulcahy Accounting & Risk Cons I-2015-8 Mulcahy Accounting & Risk Cons D 10/08/2015 000000 100 1511.521200.00 Professional Services Mulcahy Accounting & 1,291.66 I-2015-9 Mulcahy Accounting & Risk Cons D 10/08/2015 000000 100 1511.521200.00 Professional Services Mulcahy Accounting & 3,291.66 4,583.32 001421 Chattahoochee River 911 Author I-November 2015 Chattahoochee River 911 Author D 10/26/2015 000000 215 3800.571000.00 Intergovernmental-E911 Chattahoochee River 93,750.00 93,750.00 001480 Interdev, LLC I-1004795 Interdev, LLC D 10/31/2015 000000 100 1535.521100.01 Official/Admin Svcs Interdev, LLC 38,173.50 38,173.50 001551 Jacobs I-EEXF9503-102315 Jacobs D 10/26/2015 000000 100 1570.521100.01 Official/Admin Svcs Jacobs 25,662.75 25,662.75 001685 J.P. Morgan Chase Commercial C I-October 2015 J.P. Morgan Chase Commercial C D 10/26/2015 000000 100 0000.121110.00 PCard A/P Control J.P. Morgan Chase Co 64,877.14 64,877.14 001914 PCE Atlanta Office, LLC I-41pc-t00029600/Oct PCE Atlanta Office, LLC D 10/01/2015 000000 100 1565.531230.00 Electricity PCE Atlanta Office, 1,521.19 100 1565.522300.00 Rentals PCE Atlanta Office, 3,346.62 100 0000.123310.00 Abated Rent PCE Atlanta Office, 43,724.87 100 3200.522200.00 Repairs & Maintenance PCE Atlanta Office, 658.47 49,251.15
SLIDE 30
11/16/2015 9:13 AM A/P HISTORY CHECK REPORT PAGE: 5 VENDOR SET: 01 City of Dunwoody, GA BANK: 03 Suntrust Disbursement Acc DATE RANGE:10/01/2015 THRU 10/31/2015 CHECK CHECK CHECK CHECK VENDOR I.D. NAME STATUS DATE AMOUNT DISCOUNT NO STATUS AMOUNT 001914 PCE Atlanta Office, LLC I-PC41-100/340-Nov15 PCE Atlanta Office, LLC D 10/26/2015 000000 100 1565.522300.00 Rentals PCE Atlanta Office, 3,346.62 100 0000.123310.00 Abated Rent PCE Atlanta Office, 43,724.87 47,071.49 000137 Medcom Services, Inc I-10/3/2015 Medcom Services, Inc D 10/03/2015 000002 100 0000.121300.16 Flex Spending Ded Payable Medcom Services, Inc 242.30 242.30 000137 Medcom Services, Inc I-10/24/2015 Medcom Services, Inc D 10/24/2015 000002 100 0000.121300.16 Flex Spending Ded Payable Medcom Services, Inc 192.30 192.30 000008 CIT Technology Fin Serv Inc I-27509129 CIT Technology Fin Serv Inc R 10/02/2015 020122 100 1565.522300.00 Rentals CIT Technology Fin S 1,034.51 1,034.51 000074 Standard Insurance I-October 2015 Standard Insurance R 10/02/2015 020123 100 1320.512100.00 Group Insurance Standard Insurance 317.75 100 1330.512100.00 Group Insurance Standard Insurance 106.99 100 1511.512100.00 Group Insurance Standard Insurance 162.68 100 2650.512100.00 Group Insurance Standard Insurance 108.66 100 3200.512100.00 Group Insurance Standard Insurance 4,257.34 100 4100.512100.00 Group Insurance Standard Insurance 136.34 5,089.76 000088 Dekalb County Tax Commissioner I-0627904001/2015 Dekalb County Tax Commissioner R 10/02/2015 020124 100 6200.531230.00 Utilities Dekalb County Tax Co 313.06 313.06 000088 Dekalb County Tax Commissioner I-1835201011/2015 Dekalb County Tax Commissioner R 10/02/2015 020125 100 6200.531230.00 Utilities Dekalb County Tax Co 71.15 71.15 000088 Dekalb County Tax Commissioner I-1836605006 Dekalb County Tax Commissioner R 10/02/2015 020126 100 6200.531230.00 Utilities Dekalb County Tax Co 3,756.72 3,756.72 000088 Dekalb County Tax Commissioner I-1837601003/2015 Dekalb County Tax Commissioner R 10/02/2015 020127 100 6200.531230.00 Utilities Dekalb County Tax Co 184.99 184.99 000088 Dekalb County Tax Commissioner I-1837601005/2015 Dekalb County Tax Commissioner R 10/02/2015 020128 100 6200.531230.00 Utilities Dekalb County Tax Co 1,800.10 1,800.10
SLIDE 31
11/16/2015 9:13 AM A/P HISTORY CHECK REPORT PAGE: 6 VENDOR SET: 01 City of Dunwoody, GA BANK: 03 Suntrust Disbursement Acc DATE RANGE:10/01/2015 THRU 10/31/2015 CHECK CHECK CHECK CHECK VENDOR I.D. NAME STATUS DATE AMOUNT DISCOUNT NO STATUS AMOUNT 000129 Verizon Wireless Services LLC I-9752275425 Verizon Wireless Services LLC R 10/02/2015 020129 100 1110.523200.00 Communications Verizon Wireless Ser 66.02 100 1110.523200.00 Communications Verizon Wireless Ser 38.01 100 1320.523200.00 Communications Verizon Wireless Ser 137.49 100 1330.523200.00 Communications Verizon Wireless Ser 93.24 100 1511.523200.00 Communications Verizon Wireless Ser 97.62 100 2650.523200.00 Communications Verizon Wireless Ser 60.72 100 3200.523200.00 Communications Verizon Wireless Ser 6,568.08 100 4100.523200.00 Communications Verizon Wireless Ser 98.73 100 6200.523200.00 Communications Verizon Wireless Ser 38.01 7,197.92 000133 CASH I-15-005795 CASH R 10/02/2015 020130 100 3200.531100.00 Supplies-General CASH 26.00 26.00 000149 AT&T I-Oct 2015 AT&T R 10/02/2015 020131 100 1535.523200.00 Communications AT&T 132.29 132.29 000149 AT&T I-October 2015 AT&T R 10/02/2015 020132 100 1535.523200.00 Communications AT&T 123.82 123.82 000159 Purchase Power I-September 2015 Purchase Power R 10/02/2015 020133 100 1110.523200.00 Communications Purchase Power 2.43 100 1320.523200.00 Communications Purchase Power 0.49 100 1330.523200.00 Communications Purchase Power 3.37 100 1512.523200.00 Communications Purchase Power 53.85 100 1516.523200.00 Communications Purchase Power 632.45 100 1517.523200.00 Communications Purchase Power 6.10 100 1540.523200.00 Communications Purchase Power 0.49 100 2650.523200.00 Communications Purchase Power 105.14 100 3200.523200.00 Communications Purchase Power 60.02 100 4100.523200.00 Communications Purchase Power 6.05 100 7000.523200.00 Communications Purchase Power 58.86 929.25 000163 Metro Materials Inc. I-41124 Metro Materials Inc. R 10/02/2015 020134 100 4200.531100.00 Supplies Metro Materials Inc. 907.04 I-41194 Metro Materials Inc. R 10/02/2015 020134 100 4200.531100.00 Supplies Metro Materials Inc. 3,856.58 I-41255 Metro Materials Inc. R 10/02/2015 020134 100 4200.531100.00 Supplies Metro Materials Inc. 1,068.31 5,831.93
SLIDE 32
11/16/2015 9:13 AM A/P HISTORY CHECK REPORT PAGE: 7 VENDOR SET: 01 City of Dunwoody, GA BANK: 03 Suntrust Disbursement Acc DATE RANGE:10/01/2015 THRU 10/31/2015 CHECK CHECK CHECK CHECK VENDOR I.D. NAME STATUS DATE AMOUNT DISCOUNT NO STATUS AMOUNT 000165 Vulcan Materials Company I-11354194 Vulcan Materials Company R 10/02/2015 020135 100 4200.531100.00 Supplies Vulcan Materials Com 566.80 566.80 000206 Georgia Power I-05318-67204/Sept15 Georgia Power R 10/02/2015 020136 100 4100.531230.00 Electricity Georgia Power 801.09 801.09 000206 Georgia Power I-09153-15043/Sept15 Georgia Power R 10/02/2015 020137 100 6200.531230.00 Utilities Georgia Power 24.38 24.38 000206 Georgia Power I-10230-32056/Sept15 Georgia Power R 10/02/2015 020138 100 6200.531230.00 Utilities Georgia Power 24.30 24.30 000206 Georgia Power I-11317-75286/Sept15 Georgia Power R 10/02/2015 020139 100 6200.531230.00 Utilities Georgia Power 13.03 13.03 000206 Georgia Power I-12030-46085/Sept15 Georgia Power R 10/02/2015 020140 100 6200.531230.00 Utilities Georgia Power 24.30 24.30 000206 Georgia Power I-15158-51225/Sept15 Georgia Power R 10/02/2015 020141 100 6200.531230.00 Utilities Georgia Power 197.93 197.93 000206 Georgia Power I-24953-72008/Sept15 Georgia Power R 10/02/2015 020142 100 6200.531230.00 Utilities Georgia Power 109.18 109.18 000206 Georgia Power I-26354-99019/Sept15 Georgia Power R 10/02/2015 020143 100 6200.531230.00 Utilities Georgia Power 24.30 24.30 000262 Dunwoody Perimeter Chamber I-7074 Dunwoody Chamber of Commerce I R 10/02/2015 020144 100 7500.523300.00 Advertising Dunwoody Chamber of 1,250.00 1,250.00 000269 DeKalb County Georgia I-6305622/Sept 2015 DeKalb County Georgia R 10/02/2015 020145 100 6200.531230.00 Utilities DeKalb County Georgi 60.99 I-6697277/Sept2015 DeKalb County Georgia R 10/02/2015 020145 100 6200.531230.00 Utilities DeKalb County Georgi 30.00 I-6698863/Sept15 DeKalb County Georgia R 10/02/2015 020145 100 6200.531230.00 Utilities DeKalb County Georgi 65.52 156.51
SLIDE 33
11/16/2015 9:13 AM A/P HISTORY CHECK REPORT PAGE: 8 VENDOR SET: 01 City of Dunwoody, GA BANK: 03 Suntrust Disbursement Acc DATE RANGE:10/01/2015 THRU 10/31/2015 CHECK CHECK CHECK CHECK VENDOR I.D. NAME STATUS DATE AMOUNT DISCOUNT NO STATUS AMOUNT 000296 Cummins Power South I-0101-54072 Cummins Power South R 10/02/2015 020146 100 1565.522200.00 Repairs & Maintenance Cummins Power South 754.85 754.85 000331 Tyler Technologies, Inc I-025-134956 Tyler Technologies, Inc R 10/02/2015 020147 100 1512.522200.00 Repairs & Maintenance Tyler Technologies, 723.51 I-025-135597 Tyler Technologies, Inc R 10/02/2015 020147 100 2650.522200.00 Repairs & Maintenance Tyler Technologies, 200.00 923.51 001009 Kimley-Horn and Associates, In I-019124010-0815 Kimley-Horn and Associates, In R 10/02/2015 020148 350 6200.541200.00 Site improvements Kimley-Horn and Asso 2,902.65 I-7054792 Kimley-Horn and Associates, In R 10/02/2015 020148 350 4200.541400.00 Infrastructure Kimley-Horn and Asso 13,417.59 16,320.24 001026 Guardian - Appleton I-October 2015 Guardian - Appleton R 10/02/2015 020149 100 1110.512100.00 Group Insurance Guardian - Appleton 330.62 100 1320.512100.00 Group Insurance Guardian - Appleton 224.75 100 1330.512100.00 Group Insurance Guardian - Appleton 71.67 100 1511.512100.00 Group Insurance Guardian - Appleton 131.09 100 2650.512100.00 Group Insurance Guardian - Appleton 127.88 100 3200.512100.00 Group Insurance Guardian - Appleton 4,788.23 100 4100.512100.00 Group Insurance Guardian - Appleton 131.09 5,805.33 001097 US Department of Homeland Secu I-SAVE-354693 US Department of Homeland Secu R 10/02/2015 020150 100 1516.521300.00 Technical Services US Department of Hom 25.00 25.00 001107 TerraMark I-T2014-138-8162 Screening R 10/02/2015 020151 560 4320.521200.09 Prof Svcs-Stormwater Screening 4,025.00 I-T2014-138-8569 2015 Dry Weather Screen R 10/02/2015 020151 560 4320.522200.00 Repairs & Maintenance 2015 Dry Weather Scr 1,680.00 5,705.00 001274 Nova Engineering and Environme I-0110545 Nova Engineering and Environme R 10/02/2015 020152 350 4200.522200.00 Repairs & Maintenance Nova Engineering and 11,671.25 11,671.25 001275 LMI Systems, Inc I-1061449 LMI Systems, Inc R 10/02/2015 020153 100 6200.522200.06 R&M-Parks LMI Systems, Inc 1,740.22 I-1061776 LMI Systems, Inc R 10/02/2015 020153 100 6200.522200.06 R&M-Parks LMI Systems, Inc 204.00 1,944.22
SLIDE 34
11/16/2015 9:13 AM A/P HISTORY CHECK REPORT PAGE: 9 VENDOR SET: 01 City of Dunwoody, GA BANK: 03 Suntrust Disbursement Acc DATE RANGE:10/01/2015 THRU 10/31/2015 CHECK CHECK CHECK CHECK VENDOR I.D. NAME STATUS DATE AMOUNT DISCOUNT NO STATUS AMOUNT 001333 E. Harriman Construction, Inc. I-0915-15 E. Harriman Construction, Inc. R 10/02/2015 020154 350 1565.541300.00 Buildings E. Harriman Construc 22,941.00 I-0917-15 E. Harriman Construction, Inc. R 10/02/2015 020154 100 6200.522200.06 R&M-Parks E. Harriman Construc 837.00 23,778.00 001414 Geo-Hydro Engineers, Inc. I-49745 Geo-Hydro Engineers, Inc. R 10/02/2015 020155 350 4200.522200.00 Repairs & Maintenance Geo-Hydro Engineers, 5,775.60 I-50283 Geo-Hydro Engineers, Inc. R 10/02/2015 020155 350 6200.541200.00 Site improvements Geo-Hydro Engineers, 1,713.20 I-50294 Geo-Hydro Engineers, Inc. R 10/02/2015 020155 350 6200.541200.00 Site improvements Geo-Hydro Engineers, 2,383.20 9,872.00 001415 Rite Way I-374527 Rite Way R 10/02/2015 020156 100 6200.522200.06 R&M-Parks Rite Way 1,621.32 1,621.32 001444 Kenneth Wickham I-09/16/2015 Kenneth Wickham R 10/02/2015 020157 100 2650.521200.00 Prof Svcs Kenneth Wickham 400.00 400.00 001477 Gresham, Smith and Partners I-688485 Gresham, Smith and Partners R 10/02/2015 020158 100 4100.521200.00 Prof Svcs Gresham, Smith and P 13,903.13 13,903.13 001484 URS Corporation I-37622049 URS Corporation R 10/02/2015 020159 350 4200.541400.00 Infrastructure URS Corporation 1,200.00 250 4002.541400.14 TAP-Infrastructure URS Corporation 4,800.00 6,000.00 001493 Entek I-30925 Entek R 10/02/2015 020160 100 1565.522200.00 Repairs & Maintenance Entek 619.00 I-31521 Entek R 10/02/2015 020160 100 1565.522200.00 Repairs & Maintenance Entek 425.10 1,044.10 001496 Fisher Broyles I-64748 Fisher Broyles R 10/02/2015 020161 960 6200.541200.00 Site improvements Fisher Broyles 2,750.00 2,750.00 001517 Southern Premier Contractors, I-DUN-260 4664 N. Peachtree Rd. R 10/02/2015 020162 560 4320.522200.00 Repairs & Maintenance 4664 N. Peachtree Rd 3,030.13 I-DUN-264 5305 Cedar Chase R 10/02/2015 020162 560 4320.522200.00 Repairs & Maintenance 5305 Cedar Chase 1,700.80 I-DUN-265 Roberts Drive R 10/02/2015 020162 560 4320.522200.00 Repairs & Maintenance Roberts Drive 789.85 5,520.78
SLIDE 35
11/16/2015 9:13 AM A/P HISTORY CHECK REPORT PAGE: 10 VENDOR SET: 01 City of Dunwoody, GA BANK: 03 Suntrust Disbursement Acc DATE RANGE:10/01/2015 THRU 10/31/2015 CHECK CHECK CHECK CHECK VENDOR I.D. NAME STATUS DATE AMOUNT DISCOUNT NO STATUS AMOUNT 001528 GRT Systems Inc dba N American I-110699 GRT Systems Inc dba N American R 10/02/2015 020163 100 6200.522200.06 R&M-Parks GRT Systems Inc dba 538.45 I-110960 GRT Systems Inc dba N American R 10/02/2015 020163 100 6200.522200.06 R&M-Parks GRT Systems Inc dba 85.00 623.45 001542 Southeastern Engineering Inc ( I-16620 Southeastern Engineering Inc ( R 10/02/2015 020164 350 4200.541400.00 Infrastructure Southeastern Enginee 5,625.00 5,625.00 001557 Enterprise Leasing Company of I-6858521 Enterprise Leasing Company of R 10/02/2015 020165 100 3200.522300.00 Rentals Enterprise Leasing C 70.00 I-7016422 Enterprise Leasing Company of R 10/02/2015 020165 100 3200.523500.00 Travel Enterprise Leasing C 33.82 103.82 00159b Pitney Bowes Global Financial I-9938656-SP15 Pitney Bowes Global Financial R 10/02/2015 020166 100 1565.522300.00 Rentals Pitney Bowes Global 771.00 771.00 001656 De Lage Landen I-47304005 De Lage Landen R 10/02/2015 020167 100 3200.522300.00 Rentals De Lage Landen 304.00 I-47315983 De Lage Landen R 10/02/2015 020167 100 3200.522300.00 Rentals De Lage Landen 393.10 697.10 001673 Aerial Innovations of Ga., Inc I-46791 Aerial Innovations of Ga., Inc R 10/02/2015 020168 100 7000.521300.00 Technical Svcs Aerial Innovations o 94.50 I-46811 Aerial Innovations of Ga., Inc R 10/02/2015 020168 100 7000.521300.00 Technical Svcs Aerial Innovations o 57.00 151.50 001712 Mulkey, Inc. I-2013032-18 Mulkey, Inc. R 10/02/2015 020169 350 4200.541400.00 Infrastructure Mulkey, Inc. 706.56 706.56 001719 Perimeter Community Improvemen I-12615 (10) Perimeter Community Improvemen R 10/02/2015 020170 250 4006.541400.14 Bike Impl Plan-Infrastructure Perimeter Community 18,201.19 I-12615 (9) Perimeter Community Improvemen R 10/02/2015 020170 250 4006.541400.14 Bike Impl Plan-Infrastructure Perimeter Community 7,212.49 25,413.68 001727 Willmer Engineering, Inc. I-95135 Willmer Engineering, Inc. R 10/02/2015 020171 350 4200.541400.00 Infrastructure Willmer Engineering, 6,591.50 I-95137 Willmer Engineering, Inc. R 10/02/2015 020171 350 4200.541400.00 Infrastructure Willmer Engineering, 3,250.25 I-95288 Willmer Engineering, Inc. R 10/02/2015 020171
SLIDE 36
11/16/2015 9:13 AM A/P HISTORY CHECK REPORT PAGE: 11 VENDOR SET: 01 City of Dunwoody, GA BANK: 03 Suntrust Disbursement Acc DATE RANGE:10/01/2015 THRU 10/31/2015 CHECK CHECK CHECK CHECK VENDOR I.D. NAME STATUS DATE AMOUNT DISCOUNT NO STATUS AMOUNT 001727 Willmer Engineering, ICONT I-95288 Willmer Engineering, Inc. R 10/02/2015 020171 350 4200.541400.00 Infrastructure Willmer Engineering, 1,966.90 I-95289 Willmer Engineering, Inc. R 10/02/2015 020171 350 4200.541400.00 Infrastructure Willmer Engineering, 557.45 I-95338 Willmer Engineering, Inc. R 10/02/2015 020171 350 4200.541400.00 Infrastructure Willmer Engineering, 133.65 12,499.75 001732 AT&T Mobility II LLC I-070155-0615 AT&T Mobility II LLC R 10/02/2015 020172 215 3800.523200.00 Communications AT&T Mobility II LLC 6,025.80 6,025.80 001756 Georgia Snacks I-132 Georgia Snacks R 10/02/2015 020173 100 1540.512900.00 Other Employment Benefits Georgia Snacks 1,000.00 1,000.00 001767 Stantec Consulting Services, I I-806475 Stantec Consulting Services, I R 10/02/2015 020174 100 6200.522200.06 R&M-Parks Stantec Consulting S 1,942.50 1,942.50 001784 Peak Democracy, Inc. I-591 Peak Democracy, Inc. R 10/02/2015 020175 100 1570.521200.00 Professional Services Peak Democracy, Inc. 2,250.00 2,250.00 001795 ABM Janitorial Services - Sout I-8483177 ABM Janitorial Services - Sout R 10/02/2015 020176 100 1565.522200.00 Repairs & Maintenance ABM Janitorial Servi 325.00 I-8483178 ABM Janitorial Services - Sout R 10/02/2015 020176 100 3200.522200.00 Repairs & Maintenance ABM Janitorial Servi 418.75 743.75 001796 IPR Southeast LLC I-52603300-001 4833 Village Creek Drive R 10/02/2015 020177 560 4320.522200.00 Repairs & Maintenance 4833 Village Creek D 15,864.25 15,864.25 001801 Creative Impressions, LLC I-1824 Creative Impressions, LLC R 10/02/2015 020178 100 6200.521200.00 Professional Services Creative Impressions 810.00 810.00 001811 Federal Signal Corporation I-6130209 Federal Signal Corporation R 10/02/2015 020179 100 6200.522200.06 R&M-Parks Federal Signal Corpo 3,781.25 3,781.25 001825 Randstad US LP I-R18253829 Randstad US LP R 10/02/2015 020180 100 2650.521300.00 Technical Svcs Randstad US LP 448.90 I-R18348472 Randstad US LP R 10/02/2015 020180 100 2650.521300.00 Technical Svcs Randstad US LP 562.70 I-R18382694 Randstad US LP R 10/02/2015 020180
SLIDE 37
11/16/2015 9:13 AM A/P HISTORY CHECK REPORT PAGE: 12 VENDOR SET: 01 City of Dunwoody, GA BANK: 03 Suntrust Disbursement Acc DATE RANGE:10/01/2015 THRU 10/31/2015 CHECK CHECK CHECK CHECK VENDOR I.D. NAME STATUS DATE AMOUNT DISCOUNT NO STATUS AMOUNT 001825 Randstad US LP CONT I-R18382694 Randstad US LP R 10/02/2015 020180 100 2650.521300.00 Technical Svcs Randstad US LP 505.80 1,517.40 001838 Sustainable Water Planning & E I-1024 Sustainable Water Planning & E R 10/02/2015 020181 560 4320.522200.00 Repairs & Maintenance Sustainable Water Pl 1,770.00 I-1028 Sustainable Water Planning & E R 10/02/2015 020181 560 4320.522200.00 Repairs & Maintenance Sustainable Water Pl 2,765.00 4,535.00 001861 EmpowerD Wellness I-September 2015 EmpowerD Wellness R 10/02/2015 020182 100 1540.512900.00 Other Employment Benefits EmpowerD Wellness 1,565.42 1,565.42 001873 Evans Acquisition Services I-003 Evans Acquisition Services R 10/02/2015 020183 350 4200.541400.00 Infrastructure Evans Acquisition Se 2,500.00 2,500.00 001880 Autaco Development, LLC I-1390 Autaco Development, LLC R 10/02/2015 020184 350 4200.541400.00 Infrastructure Autaco Development, 25,844.39 I-1640 Autaco Development, LLC R 10/02/2015 020184 100 4200.522200.02 R&M - Street Maintenance Autaco Development, 3,631.00 29,475.39 001887 Columbia Enginerring and Servi I-25617 Survey at N. Peachtree R 10/02/2015 020185 560 4320.522200.00 Repairs & Maintenance Survey at N. Peachtr 3,850.00 I-25618 Columbia Enginerring and Servi R 10/02/2015 020185 560 4320.522200.00 Repairs & Maintenance Columbia Enginerring 1,250.00 5,100.00 001888 GS Construction, Inc. I-Pay App 6 Road GS Construction, Inc. R 10/02/2015 020186 350 4200.541400.00 Infrastructure GS Construction, Inc 103,086.00 103,086.00 001902 South Cover, Inc. I-DGP7733 Georgetown Park R 10/02/2015 020187 350 6200.542000.00 Machinery & Equipment Georgetown Park 65,000.00 65,000.00 001911 Fifth Third Bank Legal Entry I-125971/15-002955 Fifth Third Bank Legal Entry R 10/02/2015 020188 100 3200.521300.00 Technical Svcs Fifth Third Bank Leg 27.56 27.56 001915 Great Southern Publishers, Inc I-NS081815DP1 Great Southern Publishers, Inc R 10/02/2015 020189 100 3200.523300.00 Advertising Great Southern Publi 795.00 795.00
SLIDE 38
11/16/2015 9:13 AM A/P HISTORY CHECK REPORT PAGE: 13 VENDOR SET: 01 City of Dunwoody, GA BANK: 03 Suntrust Disbursement Acc DATE RANGE:10/01/2015 THRU 10/31/2015 CHECK CHECK CHECK CHECK VENDOR I.D. NAME STATUS DATE AMOUNT DISCOUNT NO STATUS AMOUNT 001925 SHI International Corporation I-B03991274 SHI International Corporation R 10/02/2015 020190 100 3200.531100.04 Supplies - Operating SHI International Co 1,084.00 1,084.00 1 Patricia Esguerra I-9/6/15 Refund Patricia Esguerra: R 10/02/2015 020191 100 0000.347900.00 Pavilion Rentals Patricia Esguerra: 200.00 200.00 1 Lekotek of Georgia I-Damage Dep Refund Lekotek of Georgia: R 10/02/2015 020192 100 0000.321900.01 Other Licenses and permits Lekotek of Georgia: 400.00 400.00 1 XO Communications Services I-Franchise Refund XO Communications Services: R 10/02/2015 020193 100 0000.311700.00 Franchise Fees XO Communications Se 52,074.13 52,074.13 1 JJSB, LLC I-Gillys Refund JJSB, LLC: R 10/02/2015 020194 100 0000.316100.00 Business & Occupation Tax JJSB, LLC: 157.47 100 0000.321100.00 Alcoholic Beverage Licenses JJSB, LLC: 3,262.78 3,420.25 1 Eric Dion Johnson I-Key Fob Eric Dion Johnson: R 10/02/2015 020195 100 3200.531100.04 Supplies - Operating Eric Dion Johnson: 250.98 250.98 1 Pebble Tossers, Inc I-Pebble Tossers Pebble Tossers, Inc: R 10/02/2015 020196 100 0000.347900.00 Pavilion Rentals Pebble Tossers, Inc: 400.00 100 0000.321900.01 Other Licenses and permits Pebble Tossers, Inc: 300.00 700.00 1 Pebble Tossers, Inc I-Sign Deposit Refun Pebble Tossers, Inc: R 10/02/2015 020197 100 0000.127103.00 Special Event Sign Dep PayablePebble Tossers, Inc: 100.00 100.00 000016 Stone, McElroy & Associates I-2537PA Stone, McElroy & Associates R 10/16/2015 020199 100 3200.521200.00 Prof Svcs Stone, McElroy & Ass 350.00 350.00 000021 Employment Screening Services I-268782 Employment Screening Services R 10/16/2015 020200 100 1540.521300.00 Technical Services Employment Screening 139.50 139.50 000061 Blue Cross Blue Shield I-0006450004G Blue Cross Blue Shield R 10/16/2015 020201 100 1110.512100.00 Group Insurance Blue Cross Blue Shie 3,847.73 100 1320.512100.00 Group Insurance Blue Cross Blue Shie 2,558.44 100 1330.512100.00 Group Insurance Blue Cross Blue Shie 1,074.54 100 1511.512100.00 Group Insurance Blue Cross Blue Shie 1,560.65
SLIDE 39
11/16/2015 9:13 AM A/P HISTORY CHECK REPORT PAGE: 14 VENDOR SET: 01 City of Dunwoody, GA BANK: 03 Suntrust Disbursement Acc DATE RANGE:10/01/2015 THRU 10/31/2015 CHECK CHECK CHECK CHECK VENDOR I.D. NAME STATUS DATE AMOUNT DISCOUNT NO STATUS AMOUNT 000061 Blue Cross Blue ShieldCONT I-0006450004G Blue Cross Blue Shield R 10/16/2015 020201 100 1540.512100.00 Group Insurance Blue Cross Blue Shie 1,074.54 100 2650.512100.00 Group Insurance Blue Cross Blue Shie 1,562.50 100 3200.512100.00 Group Insurance Blue Cross Blue Shie 59,159.28 100 4100.512100.00 Group Insurance Blue Cross Blue Shie 1,560.65 72,398.33 000089 APeal Agency, Inc. I-290 APeal Agency, Inc. R 10/16/2015 020202 100 3200.521200.00 Prof Svcs APeal Agency, Inc. 276.00 276.00 000118 Peace Officers' I-October 2015 Peace Officers' R 10/16/2015 020203 100 0000.121300.15 POAB Deduction Payable Peace Officers' 660.00 660.00 000130 Translation Station, INC I-08182015 Translation Station, INC R 10/16/2015 020204 100 2650.521300.00 Technical Svcs Translation Station, 379.00 I-51944 Translation Station, INC R 10/16/2015 020204 100 2650.521300.00 Technical Svcs Translation Station, 179.78 I-52249 Translation Station, INC R 10/16/2015 020204 100 2650.521300.00 Technical Svcs Translation Station, 309.90 I-52424 Translation Station, INC R 10/16/2015 020204 100 2650.521300.00 Technical Svcs Translation Station, 316.80 I-52531 Translation Station, INC R 10/16/2015 020204 100 2650.521300.00 Technical Svcs Translation Station, 444.16 I-52683 Translation Station, INC R 10/16/2015 020204 100 2650.521300.00 Technical Svcs Translation Station, 314.50 I-52859 Translation Station, INC R 10/16/2015 020204 100 2650.521300.00 Technical Svcs Translation Station, 419.15 2,363.29 000138 Riley McLendon, LLC I-52928 Riley McLendon, LLC R 10/16/2015 020205 350 4200.541400.00 Infrastructure Riley McLendon, LLC 755.56 I-62922 Riley McLendon, LLC R 10/16/2015 020205 100 1530.521200.01 Prof Svcs-Legal Riley McLendon, LLC 12,500.00 I-62924 Riley McLendon, LLC R 10/16/2015 020205 100 1530.521200.02 Prof Svcs-Litigation Riley McLendon, LLC 3,271.00 I-62925 Riley McLendon, LLC R 10/16/2015 020205 100 2650.521200.03 Prof Svcs-Court Solicitor Riley McLendon, LLC 7,395.00 I-62926 Riley McLendon, LLC R 10/16/2015 020205 350 4200.541400.00 Infrastructure Riley McLendon, LLC 63.00 I-62927 Riley McLendon, LLC R 10/16/2015 020205 560 4320.521200.09 Prof Svcs-Stormwater Riley McLendon, LLC 136.66 24,121.22
SLIDE 40
11/16/2015 9:13 AM A/P HISTORY CHECK REPORT PAGE: 15 VENDOR SET: 01 City of Dunwoody, GA BANK: 03 Suntrust Disbursement Acc DATE RANGE:10/01/2015 THRU 10/31/2015 CHECK CHECK CHECK CHECK VENDOR I.D. NAME STATUS DATE AMOUNT DISCOUNT NO STATUS AMOUNT 000149 AT&T I-November 2015 AT&T R 10/16/2015 020206 100 1535.523200.00 Communications AT&T 141.09 141.09 000150 Fidelity Security Life Insuran I-7021254 Fidelity Security Life Insuran R 10/16/2015 020207 100 0000.121300.12 EE-Vision Payable Fidelity Security Li 481.34 481.34 000156 Powell, Hugh R I-2037 Powell, Hugh R R 10/16/2015 020208 100 2650.521200.00 Prof Svcs Powell, Hugh R 1,350.00 1,350.00 000160 Georgia Technology Authority I-924-660880915 Georgia Technology Authority R 10/16/2015 020209 100 3200.521300.00 Technical Svcs Georgia Technology A 432.99 432.99 000163 Metro Materials Inc. I-41322 Metro Materials Inc. R 10/16/2015 020210 100 4200.531100.00 Supplies Metro Materials Inc. 1,305.71 1,305.71 000165 Vulcan Materials Company I-11368815 Vulcan Materials Company R 10/16/2015 020211 100 4200.531100.00 Supplies Vulcan Materials Com 780.85 I-11376955 Vulcan Materials Company R 10/16/2015 020211 560 4320.531100.00 Supplies Vulcan Materials Com 575.83 I-21212025088 Vulcan Materials Company R 10/16/2015 020211 560 4320.531100.00 Supplies Vulcan Materials Com 428.50 I-21212025138 Vulcan Materials Company R 10/16/2015 020211 560 4320.531100.00 Supplies Vulcan Materials Com 428.50 2,213.68 000196 Georgia Management Agency, Inc I-59054 Georgia Management Agency, Inc R 10/16/2015 020212 560 4320.522200.00 Repairs & Maintenance Georgia Management A 26,054.03 100 4200.522200.02 R&M - Street Maintenance Georgia Management A 33,906.60 I-59065 Georgia Management Agency, Inc R 10/16/2015 020212 560 4320.522200.00 Repairs & Maintenance Georgia Management A 25,600.51 100 4200.522200.02 R&M - Street Maintenance Georgia Management A 40,870.60 126,431.74 000206 Georgia Power I-2363815 Georgia Power R 10/16/2015 020213 350 6200.541200.00 Site improvements Georgia Power 604.00 604.00 000206 Georgia Power I-September 2015 Georgia Power R 10/16/2015 020214 100 4100.531230.00 Electricity Georgia Power 38,819.03 100 6200.531230.00 Utilities Georgia Power 7,863.27 46,682.30
SLIDE 41
11/16/2015 9:13 AM A/P HISTORY CHECK REPORT PAGE: 16 VENDOR SET: 01 City of Dunwoody, GA BANK: 03 Suntrust Disbursement Acc DATE RANGE:10/01/2015 THRU 10/31/2015 CHECK CHECK CHECK CHECK VENDOR I.D. NAME STATUS DATE AMOUNT DISCOUNT NO STATUS AMOUNT 000210 Rotary Club of Dunwoody, GA In I-3537 Rotary Club of Dunwoody, GA In R 10/16/2015 020215 100 1110.523600.00 Dues & Fees Rotary Club of Dunwo 425.00 I-Special Event Ref Rotary Club of Dunwoody, GA In R 10/16/2015 020215 100 0000.321900.01 Other Licenses and permits Rotary Club of Dunwo 1,100.00 1,525.00 000262 Dunwoody Perimeter Chamber I-7016 Dunwoody Perimeter Chamber R 10/16/2015 020216 100 7500.523300.00 Advertising Dunwoody Perimeter C 240.00 I-7084 Dunwoody Perimeter Chamber R 10/16/2015 020216 100 1110.523600.00 Dues & Fees Dunwoody Perimeter C 25.00 265.00 000269 DeKalb County Georgia I-6305611/Sept 2015 DeKalb County Georgia R 10/16/2015 020217 100 6200.531230.00 Utilities DeKalb County Georgi 64.94 I-6305655/Sept2015 DeKalb County Georgia R 10/16/2015 020217 100 6200.531230.00 Utilities DeKalb County Georgi 72.15 I-6305677/Sept 2015 DeKalb County Georgia R 10/16/2015 020217 100 6200.531230.00 Utilities DeKalb County Georgi 359.87 I-6305688/Sept 2015 DeKalb County Georgia R 10/16/2015 020217 100 6200.531230.00 Utilities DeKalb County Georgi 42.88 539.84 000331 Tyler Technologies, Inc I-025-136685 Tyler Technologies, Inc R 10/16/2015 020218 100 2650.522200.00 Repairs & Maintenance Tyler Technologies, 1,415.00 1,415.00 001065 State Road and Tollway Authori I-LCI Project T-7 State Road and Tollway Authori R 10/16/2015 020219 100 4100.523600.00 Dues & Fees State Road and Tollw 250.00 250.00 001097 US Department of Homeland Secu I-SAVE-356018 US Department of Homeland Secu R 10/16/2015 020220 100 1516.521300.00 Technical Services US Department of Hom 25.00 25.00 001107 TerraMark I-T2014-138-8366 TerraMark R 10/16/2015 020221 560 4320.521200.09 Prof Svcs-Stormwater TerraMark 7,362.30 I-T2014-138-8512 TerraMark R 10/16/2015 020221 560 4320.521200.09 Prof Svcs-Stormwater TerraMark 2,462.30 9,824.60 001274 Nova Engineering and Environme I-0112329 Nova Engineering and Environme R 10/16/2015 020222 350 4200.522200.00 Repairs & Maintenance Nova Engineering and 13,977.50 13,977.50
SLIDE 42
11/16/2015 9:13 AM A/P HISTORY CHECK REPORT PAGE: 17 VENDOR SET: 01 City of Dunwoody, GA BANK: 03 Suntrust Disbursement Acc DATE RANGE:10/01/2015 THRU 10/31/2015 CHECK CHECK CHECK CHECK VENDOR I.D. NAME STATUS DATE AMOUNT DISCOUNT NO STATUS AMOUNT 001277 Allied Paving Contractors, Inc I-6871 Allied Paving Contractors, Inc R 10/16/2015 020223 350 4200.522200.00 Repairs & Maintenance Allied Paving Contra 528,449.30 528,449.30 001328 LexisNexis Risk Data Managemen I-1502895-20150930 LexisNexis Risk Data Managemen R 10/16/2015 020224 100 1511.521300.00 Technical Services LexisNexis Risk Data 50.00 50.00 001345 JEL Consulting Group, LLC I-232 JEL Consulting Group, LLC R 10/16/2015 020225 100 7500.521200.00 Professional Services JEL Consulting Group 2,500.00 2,500.00 001443 Arborgaurd I-Iatl70872 Arborgaurd R 10/16/2015 020226 560 4320.522200.00 Repairs & Maintenance Arborgaurd 180.00 I-Iatl73425 Arborgaurd R 10/16/2015 020226 560 4320.522200.00 Repairs & Maintenance Arborgaurd 90.00 270.00 001444 Kenneth Wickham I-9/30/2015 Kenneth Wickham R 10/16/2015 020227 100 2650.521200.00 Prof Svcs Kenneth Wickham 400.00 400.00 001549 Gas South, LLC I-October 2015 Gas South, LLC R 10/16/2015 020228 100 6200.531230.00 Utilities Gas South, LLC 483.79 483.79 001605 Planners & Engineers Collabora I-34410 Planners & Engineers Collabora R 10/16/2015 020229 560 4320.522200.00 Repairs & Maintenance Planners & Engineers 1,135.00 1,135.00 001650 American United Life Insurance I-20150901AR01 American United Life Insurance R 10/16/2015 020230 100 1540.512900.00 Other Employment Benefits American United Life 312.50 312.50 001686 Emily G's LLC I-1265 Emily G's LLC R 10/16/2015 020231 100 1570.531100.00 Supplies Emily G's LLC 125.99 125.99 001690 Oldcastle Precast Inc. I-410131578 Oldcastle Precast Inc. R 10/16/2015 020232 560 4320.531100.00 Supplies Oldcastle Precast In 546.45 I-410131674 Oldcastle Precast Inc. R 10/16/2015 020232 560 4320.531100.00 Supplies Oldcastle Precast In 127.05 673.50
SLIDE 43
11/16/2015 9:13 AM A/P HISTORY CHECK REPORT PAGE: 18 VENDOR SET: 01 City of Dunwoody, GA BANK: 03 Suntrust Disbursement Acc DATE RANGE:10/01/2015 THRU 10/31/2015 CHECK CHECK CHECK CHECK VENDOR I.D. NAME STATUS DATE AMOUNT DISCOUNT NO STATUS AMOUNT 001750 Riley McLendon, LLC II I-Parcel 1 Riley McLendon, LLC II R 10/16/2015 020233 350 4200.541400.00 Infrastructure Riley McLendon, LLC 15,000.00 15,000.00 001799 Colliers International - Atlan I-October 2015 Colliers International - Atlan R 10/16/2015 020234 100 0000.381100.00 Rental Commissions Colliers Internation 370.92 370.92 001820 Sharon Dickson, LLC I-09/23/2015 Sharon Dickson, LLC R 10/16/2015 020235 100 2650.521200.00 Prof Svcs Sharon Dickson, LLC 400.00 400.00 001824 Veith Traffic Services, LLC I-3011-17 Veith Traffic Services, LLC R 10/16/2015 020236 100 4200.522200.03 R&M - Traffic Signals Veith Traffic Servic 640.00 640.00 001825 Randstad US LP I-R18447421 Randstad US LP R 10/16/2015 020237 100 2650.521300.00 Technical Svcs Randstad US LP 423.61 423.61 001832 NEC CORPORATION OF AMERICA I-MC000033261 NEC CORPORATION OF AMEROCA R 10/16/2015 020238 100 3200.522200.01 Repairs & Maintenance-SoftwareNEC CORPORATION OF A 6,073.00 6,073.00 001833 Marny Heit I-Bryant Steward Marny Heit R 10/16/2015 020239 100 2650.521200.04 Prof Svcs-Public Defender Marny Heit 240.00 I-Carolyn Demere Marny Heit R 10/16/2015 020239 100 2650.521200.04 Prof Svcs-Public Defender Marny Heit 170.00 I-Denise Lowe Marny Heit R 10/16/2015 020239 100 2650.521200.04 Prof Svcs-Public Defender Marny Heit 240.00 I-Karen Macias Marny Heit R 10/16/2015 020239 100 2650.521200.04 Prof Svcs-Public Defender Marny Heit 290.00 I-Larnetta Hawthorne Marny Heit R 10/16/2015 020239 100 2650.521200.04 Prof Svcs-Public Defender Marny Heit 120.00 I-Rebecca Dubose Marny Heit R 10/16/2015 020239 100 2650.521200.04 Prof Svcs-Public Defender Marny Heit 190.00 I-Tracy Wilson Marny Heit R 10/16/2015 020239 100 2650.521200.04 Prof Svcs-Public Defender Marny Heit 190.00 1,440.00 001868 American Heritage Life Insuran I-19795/October 2015 American Heritage Life Insuran R 10/16/2015 020240 100 0000.121300.18 AFLAC Deductions Payable American Heritage Li 1,819.08 1,819.08
SLIDE 44
11/16/2015 9:13 AM A/P HISTORY CHECK REPORT PAGE: 19 VENDOR SET: 01 City of Dunwoody, GA BANK: 03 Suntrust Disbursement Acc DATE RANGE:10/01/2015 THRU 10/31/2015 CHECK CHECK CHECK CHECK VENDOR I.D. NAME STATUS DATE AMOUNT DISCOUNT NO STATUS AMOUNT 001870 Health Point Chiropractic & We I-September 2015 Health Point Chiropractic & We R 10/16/2015 020241 100 1540.512900.00 Other Employment Benefits Health Point Chiropr 385.00 385.00 001873 Evans Acquisition Services I-4 Evans Acquisition Services R 10/16/2015 020242 350 4200.541400.00 Infrastructure Evans Acquisition Se 625.00 625.00 001885 Baldwin Paving Company, Inc. I-Pay App 2 Baldwin Paving Company, Inc. R 10/16/2015 020243 350 4200.522200.00 Repairs & Maintenance Baldwin Paving Compa 389,557.50 389,557.50 001917 Reliable Traffic Data Services I-3721 Reliable Traffic Data Services R 10/16/2015 020244 100 4100.521200.00 Prof Svcs Reliable Traffic Dat 2,880.00 2,880.00 001926 Greater Gwinnett Plumbing, Inc I-9914 Greater Gwinnett Plumbing, Inc R 10/16/2015 020245 100 6200.522200.06 R&M-Parks Greater Gwinnett Plu 158.00 I-9917 Greater Gwinnett Plumbing, Inc R 10/16/2015 020245 100 6200.522200.06 R&M-Parks Greater Gwinnett Plu 189.00 347.00 001928 Kilpatrick Townsend & Stockton I-11683151 Kilpatrick Townsend & Stockton R 10/16/2015 020246 100 1530.521200.02 Prof Svcs-Litigation Kilpatrick Townsend 988.00 988.00 001929 Ecoflo Holding, Inc. I-SI061906 Ecoflo Holding, Inc. R 10/16/2015 020247 100 7000.521300.00 Technical Svcs Ecoflo Holding, Inc. 16,489.75 16,489.75 001930 Acevedo Interpretation & Media I-380 Acevedo Interpretation & Media R 10/16/2015 020248 100 2650.521300.00 Technical Svcs Acevedo Interpretati 810.00 810.00 1 SHRM I-01638930/S.Huggins SHRM: R 10/16/2015 020249 100 1540.531400.00 Books & Periodicals SHRM: 190.00 190.00 1 Cox Automotive I-9/18/15 AlcoholRef Cox Automotive: R 10/16/2015 020250 100 0000.347900.00 Pavilion Rentals Cox Automotive: 200.00 200.00 1 Kim Saunders I-9/27/15 Refund Kim Saunders: R 10/16/2015 020251 100 0000.347900.00 Pavilion Rentals Kim Saunders: 200.00 200.00
SLIDE 45
11/16/2015 9:13 AM A/P HISTORY CHECK REPORT PAGE: 20 VENDOR SET: 01 City of Dunwoody, GA BANK: 03 Suntrust Disbursement Acc DATE RANGE:10/01/2015 THRU 10/31/2015 CHECK CHECK CHECK CHECK VENDOR I.D. NAME STATUS DATE AMOUNT DISCOUNT NO STATUS AMOUNT 1 Erik Thor Bendicks MD PC I-BusTax Refund Erik Thor Bendicks MD PC: R 10/16/2015 020252 100 0000.316100.00 Business & Occupation Tax Erik Thor Bendicks M 400.00 400.00 1 Dream Dachshund Rescue I-DREAM Refund Dream Dachshund Rescue: R 10/16/2015 020253 100 0000.321100.00 Alcoholic Beverage Licenses Dream Dachshund Resc 50.00 100 0000.127103.00 Special Event Sign Dep PayableDream Dachshund Resc 100.00 100 0000.321900.01 Other Licenses and permits Dream Dachshund Resc 1,200.00 1,350.00 1 Lisa Surgi I-Hensley Refund Lisa Surgi: R 10/16/2015 020254 350 4200.541400.00 Infrastructure Lisa Surgi: 850.00 850.00 1 Reecie Campbell I-Huntington Refund Reecie Campbell: R 10/16/2015 020255 100 0000.316100.00 Business & Occupation Tax Reecie Campbell: 126.94 126.94 1 Michael Starling I-September 2015 Michael Starling: R 10/16/2015 020256 100 7500.531300.00 Food Michael Starling: 118.74 100 7500.523500.00 Travel Michael Starling: 30.00 100 7500.523300.00 Advertising Michael Starling: 750.00 898.74 1 Mother's Movie, LLC I-Sign Permit Deposi Mother's Movie, LLC: R 10/16/2015 020257 100 0000.127103.00 Special Event Sign Dep PayableMother's Movie, LLC: 250.00 250.00 1 Townies 2 Productions, LLC I-Townies Sign Dep(2 Townies 2 Productions, LLC: R 10/16/2015 020258 100 0000.127103.00 Special Event Sign Dep PayableTownies 2 Production 250.00 250.00 000008 CIT Technology Fin Serv Inc I-27652898 CIT Technology Fin Serv Inc R 10/30/2015 020259 100 1565.522300.00 Rentals CIT Technology Fin S 733.00 733.00 000029 Lowe Engineers, LLC I-15747 Stormwater Prof Fees R 10/30/2015 020260 560 4320.521200.09 Prof Svcs-Stormwater Stormwater Prof Fees 9,900.00 9,900.00 000042 Atlanta Journal-Constitution I-70859340/Renewal Atlanta Journal-Constitution R 10/30/2015 020261 100 1320.531400.00 Books & Periodicals Atlanta Journal-Cons 138.96 138.96
SLIDE 46
11/16/2015 9:13 AM A/P HISTORY CHECK REPORT PAGE: 21 VENDOR SET: 01 City of Dunwoody, GA BANK: 03 Suntrust Disbursement Acc DATE RANGE:10/01/2015 THRU 10/31/2015 CHECK CHECK CHECK CHECK VENDOR I.D. NAME STATUS DATE AMOUNT DISCOUNT NO STATUS AMOUNT 000074 Standard Insurance I-November 2015 Standard Insurance R 10/30/2015 020262 100 1320.512100.00 Group Insurance Standard Insurance 317.75 100 1330.512100.00 Group Insurance Standard Insurance 106.99 100 1511.512100.00 Group Insurance Standard Insurance 162.68 100 1540.512100.00 Group Insurance Standard Insurance 62.07 100 2650.512100.00 Group Insurance Standard Insurance 108.66 100 3200.512100.00 Group Insurance Standard Insurance 4,144.44 100 4100.512100.00 Group Insurance Standard Insurance 136.34 5,038.93 000129 Verizon Wireless Services LLC I-9753929264 Verizon Wireless Services LLC R 10/30/2015 020263 100 1110.523200.00 Communications Verizon Wireless Ser 60.68 100 1110.523200.00 Communications Verizon Wireless Ser 38.01 100 1320.523200.00 Communications Verizon Wireless Ser 136.70 100 1330.523200.00 Communications Verizon Wireless Ser 90.95 100 1511.523200.00 Communications Verizon Wireless Ser 97.58 100 2650.523200.00 Communications Verizon Wireless Ser 60.68 100 3200.523200.00 Communications Verizon Wireless Ser 7,456.57 100 4100.523200.00 Communications Verizon Wireless Ser 98.69 100 6200.523200.00 Communications Verizon Wireless Ser 38.01 8,077.87 000159 Purchase Power I-Ocotber 2015 Purchase Power R 10/30/2015 020264 100 1110.523200.00 Communications Purchase Power 8.68 100 1330.523200.00 Communications Purchase Power 4.20 100 1512.523200.00 Communications Purchase Power 78.04 100 1516.523200.00 Communications Purchase Power 2,084.54 100 1517.523200.00 Communications Purchase Power 13.28 100 1530.523200.00 Communications Purchase Power 21.54 100 1540.523200.00 Communications Purchase Power 7.06 100 2650.523200.00 Communications Purchase Power 211.26 100 3200.523200.00 Communications Purchase Power 103.45 100 4100.523200.00 Communications Purchase Power 16.16 100 7000.523200.00 Communications Purchase Power 262.23 2,810.44 000163 Metro Materials Inc. I-41397 Metro Materials Inc. R 10/30/2015 020265 100 4200.531100.00 Supplies Metro Materials Inc. 1,213.39 I-41631 Metro Materials Inc. R 10/30/2015 020265 100 4200.531100.00 Supplies Metro Materials Inc. 1,899.02 3,112.41 000165 Vulcan Materials Company I-11383053 Vulcan Materials Company R 10/30/2015 020266 100 4200.531100.00 Supplies Vulcan Materials Com 578.84 I-21212025279 Vulcan Materials Company R 10/30/2015 020266 100 4200.531100.00 Supplies Vulcan Materials Com 587.50 I-21212025893 Vulcan Materials Company R 10/30/2015 020266
SLIDE 47
11/16/2015 9:13 AM A/P HISTORY CHECK REPORT PAGE: 22 VENDOR SET: 01 City of Dunwoody, GA BANK: 03 Suntrust Disbursement Acc DATE RANGE:10/01/2015 THRU 10/31/2015 CHECK CHECK CHECK CHECK VENDOR I.D. NAME STATUS DATE AMOUNT DISCOUNT NO STATUS AMOUNT 000165 Vulcan Materials CompaCONT I-21212025893 Vulcan Materials Company R 10/30/2015 020266 100 4200.531100.00 Supplies Vulcan Materials Com 428.50 1,594.84 000196 Georgia Management Agency, Inc I-59066 Georgia Management Agency, Inc R 10/30/2015 020267 100 4200.522200.03 R&M - Traffic Signals Georgia Management A 37,009.61 37,009.61 000206 Georgia Power I-00751-7341/Sept15 Georgia Power R 10/30/2015 020268 100 6200.531230.00 Utilities Georgia Power 1,336.43 1,336.43 000210 Rotary Club of Dunwoody, GA In I-3515 Rotary Club of Dunwoody, GA In R 10/30/2015 020269 100 3200.523600.00 Dues & Fees Rotary Club of Dunwo 425.00 I-RunDunwoody Rotary Club of Dunwoody, GA In R 10/30/2015 020269 100 0000.127103.00 Special Event Sign Dep PayableRotary Club of Dunwo 100.00 100 0000.321900.01 Other Licenses and permits Rotary Club of Dunwo 600.00 1,125.00 000211 GIRMA I-233309 GIRMA R 10/30/2015 020270 100 7000.523100.01 Insurance Claims GIRMA 2,700.00 2,700.00 000211 GIRMA I-233380 GIRMA R 10/30/2015 020271 100 4100.523100.01 Claims GIRMA 603.64 603.64 000226 GA Chapter FBINAA I-Grogan-Winter Conf FBI CAAA R 10/30/2015 020272 100 3200.523700.00 Education & Training FBI CAAA 60.00 60.00 000269 DeKalb County Georgia I-5986738/Aug 2015 DeKalb County Georgia R 10/30/2015 020273 100 6200.531230.00 Utilities DeKalb County Georgi 6.28 I-6305622/Sept15 (2) DeKalb County Georgia R 10/30/2015 020273 100 6200.531230.00 Utilities DeKalb County Georgi 6.52 I-6563314/Oct 2015 DeKalb County Georgia R 10/30/2015 020273 100 6200.531230.00 Utilities DeKalb County Georgi 538.74 I-6563314/Sept 2015 DeKalb County Georgia R 10/30/2015 020273 100 6200.531230.00 Utilities DeKalb County Georgi 326.84 I-6697277/ Oct 2015 DeKalb County Georgia R 10/30/2015 020273 100 6200.531230.00 Utilities DeKalb County Georgi 63.30 I-6698863/Oct 2015 DeKalb County Georgia R 10/30/2015 020273 100 6200.531230.00 Utilities DeKalb County Georgi 138.25 1,079.93
SLIDE 48
11/16/2015 9:13 AM A/P HISTORY CHECK REPORT PAGE: 23 VENDOR SET: 01 City of Dunwoody, GA BANK: 03 Suntrust Disbursement Acc DATE RANGE:10/01/2015 THRU 10/31/2015 CHECK CHECK CHECK CHECK VENDOR I.D. NAME STATUS DATE AMOUNT DISCOUNT NO STATUS AMOUNT 000307 DeKalb County District Attorne I-15CV7526-2 DeKalb County District Attorne R 10/30/2015 020274 212 0000.351320.00 Cash Confiscation DeKalb County Distri 260.00 212 0000.351320.00 Cash Confiscation DeKalb County Distri 985.40 1,245.40 000331 Tyler Technologies, Inc I-025-138358 Tyler Technologies, Inc R 10/30/2015 020275 100 2650.522200.00 Repairs & Maintenance Tyler Technologies, 200.00 200.00 001009 Kimley-Horn and Associates, In I-7083754 Kimley-Horn and Associates, In R 10/30/2015 020276 350 4200.541400.00 Infrastructure Kimley-Horn and Asso 7,353.28 7,353.28 001026 Guardian - Appleton I-November 2015 Guardian - Appleton R 10/30/2015 020277 100 1110.512100.00 Group Insurance Guardian - Appleton 330.62 100 1320.512100.00 Group Insurance Guardian - Appleton 224.75 100 1330.512100.00 Group Insurance Guardian - Appleton 71.67 100 1511.512100.00 Group Insurance Guardian - Appleton 131.09 100 1540.512100.00 Group Insurance Guardian - Appleton 71.67 100 2650.512100.00 Group Insurance Guardian - Appleton 127.88 100 3200.512100.00 Group Insurance Guardian - Appleton 4,800.48 100 4100.512100.00 Group Insurance Guardian - Appleton 131.09 5,889.25 001198 Adrian Security Co. I-30485 Adrian Security Co. R 10/30/2015 020278 100 6200.522200.06 R&M-Parks Adrian Security Co. 817.00 817.00 001274 Nova Engineering and Environme I-0112436 Nova Engineering and Environme R 10/30/2015 020279 100 4200.522200.02 R&M - Street Maintenance Nova Engineering and 13,860.00 I-0113613 Nova Engineering and Environme R 10/30/2015 020279 100 4200.522200.02 R&M - Street Maintenance Nova Engineering and 9,397.50 23,257.50 001275 LMI Systems, Inc I-1062540 LMI Systems, Inc R 10/30/2015 020280 100 6200.522200.06 R&M-Parks LMI Systems, Inc 67.00 67.00 001316 Lose and Associates I-20150944 Lose and Associates R 10/30/2015 020281 350 6200.541200.00 Site improvements Lose and Associates 375.00 375.00 001414 Geo-Hydro Engineers, Inc. I-50467 Geo-Hydro Engineers, Inc. R 10/30/2015 020282 350 6200.541200.00 Site improvements Geo-Hydro Engineers, 1,089.00 I-50468 Geo-Hydro Engineers, Inc. R 10/30/2015 020282 350 6200.541200.00 Site improvements Geo-Hydro Engineers, 2,276.60 3,365.60
SLIDE 49
11/16/2015 9:13 AM A/P HISTORY CHECK REPORT PAGE: 24 VENDOR SET: 01 City of Dunwoody, GA BANK: 03 Suntrust Disbursement Acc DATE RANGE:10/01/2015 THRU 10/31/2015 CHECK CHECK CHECK CHECK VENDOR I.D. NAME STATUS DATE AMOUNT DISCOUNT NO STATUS AMOUNT 001415 Rite Way I-375560 Rite Way R 10/30/2015 020283 100 6200.522200.06 R&M-Parks Rite Way 1,621.32 1,621.32 001444 Kenneth Wickham I-10/21/2015 Kenneth Wickham R 10/30/2015 020284 100 2650.521200.00 Prof Svcs Kenneth Wickham 400.00 400.00 001457 Peace Officers Association of I-Rashida Moore Peace Officers Association of R 10/30/2015 020285 100 3200.523600.00 Dues & Fees Peace Officers Assoc 20.00 20.00 001477 Gresham, Smith and Partners I-0689220 Gresham, Smith and Partners R 10/30/2015 020286 100 4100.521200.00 Prof Svcs Gresham, Smith and P 13,900.00 13,900.00 001542 Southeastern Engineering Inc ( I-16770 Southeastern Engineering Inc ( R 10/30/2015 020287 350 4200.541400.00 Infrastructure Southeastern Enginee 3,100.00 I-16771 Southeastern Engineering Inc ( R 10/30/2015 020287 350 4200.541400.00 Infrastructure Southeastern Enginee 5,625.00 8,725.00 001656 De Lage Landen I-47654649 De Lage Landen R 10/30/2015 020288 100 3200.522300.00 Rentals De Lage Landen 304.00 I-47678626 De Lage Landen R 10/30/2015 020288 100 3200.522300.00 Rentals De Lage Landen 385.27 689.27 001659 Fisher & Phillips I-29769-951845 Fisher & Phillips R 10/30/2015 020289 100 1540.523700.00 Education & Training Fisher & Phillips 200.00 200.00 001712 Mulkey, Inc. I-2013032-19 Mulkey, Inc. R 10/30/2015 020290 350 4200.541400.00 Infrastructure Mulkey, Inc. 441.60 441.60 001719 Perimeter Community Improvemen I-12855 (3) Perimeter Community Improvemen R 10/30/2015 020291 250 4002.522200.12 Repairs & Maintenance - PTOP Perimeter Community 47,902.25 I-12855 (4) Perimeter Community Improvemen R 10/30/2015 020291 250 4002.522200.12 Repairs & Maintenance - PTOP Perimeter Community 203,391.56 251,293.81 001727 Willmer Engineering, Inc. I-95386 Willmer Engineering, Inc. R 10/30/2015 020292 350 4200.541400.00 Infrastructure Willmer Engineering, 2,278.60 2,278.60
SLIDE 50
11/16/2015 9:13 AM A/P HISTORY CHECK REPORT PAGE: 25 VENDOR SET: 01 City of Dunwoody, GA BANK: 03 Suntrust Disbursement Acc DATE RANGE:10/01/2015 THRU 10/31/2015 CHECK CHECK CHECK CHECK VENDOR I.D. NAME STATUS DATE AMOUNT DISCOUNT NO STATUS AMOUNT 001732 AT&T Mobility II LLC I-070155-0715 AT&T Mobility II LLC R 10/30/2015 020293 215 3800.523200.00 Communications AT&T Mobility II LLC 6,558.00 6,558.00 001756 Georgia Snacks I-137 Georgia Snacks R 10/30/2015 020294 100 1540.512900.00 Other Employment Benefits Georgia Snacks 800.00 800.00 001780 Partners Risk Services, LLC I-106356 Partners Risk Services, LLC R 10/30/2015 020295 100 6200.523100.00 Property/Liability Insurance Partners Risk Servic 3,234.40 I-106357 Partners Risk Services, LLC R 10/30/2015 020295 100 6200.523100.00 Property/Liability Insurance Partners Risk Servic 1,939.60 5,174.00 001787 Optech RWM, LLC I-D0915 Optech RWM, LLC R 10/30/2015 020296 100 4200.522200.05 R&M - Right of Way Maint Optech RWM, LLC 1,666.66 100 6200.522200.06 R&M-Parks Optech RWM, LLC 29,177.74 100 6200.531100.00 Supplies Optech RWM, LLC 7,760.50 38,604.90 001796 IPR Southeast LLC I-52605901-001 1158 Hidden Ridge Lane R 10/30/2015 020297 560 4320.522200.00 Repairs & Maintenance 1158 Hidden Ridge La 11,495.00 11,495.00 001820 Sharon Dickson, LLC I-October 2015 Sharon Dickson, LLC R 10/30/2015 020298 100 2650.521200.00 Prof Svcs Sharon Dickson, LLC 800.00 800.00 001825 Randstad US LP I-R18481174 Randstad US LP R 10/30/2015 020299 100 2650.521300.00 Technical Svcs Randstad US LP 619.61 I-R18514167 Randstad US LP R 10/30/2015 020299 100 2650.521300.00 Technical Svcs Randstad US LP 282.49 902.10 001833 Marny Heit I-Ronald Cook Marny Heit R 10/30/2015 020300 100 2650.521200.04 Prof Svcs-Public Defender Marny Heit 190.00 I-Stanley Melvin Marny Heit R 10/30/2015 020300 100 2650.521200.04 Prof Svcs-Public Defender Marny Heit 170.00 360.00 001885 Baldwin Paving Company, Inc. I-Pay App 3 Baldwin Paving Company, Inc. R 10/30/2015 020301 350 4200.522200.00 Repairs & Maintenance Baldwin Paving Compa 305,965.00 305,965.00
SLIDE 51
11/16/2015 9:13 AM A/P HISTORY CHECK REPORT PAGE: 26 VENDOR SET: 01 City of Dunwoody, GA BANK: 03 Suntrust Disbursement Acc DATE RANGE:10/01/2015 THRU 10/31/2015 CHECK CHECK CHECK CHECK VENDOR I.D. NAME STATUS DATE AMOUNT DISCOUNT NO STATUS AMOUNT 001888 GS Construction, Inc. I-Pay App 6 Water GS Construction, Inc. R 10/30/2015 020302 350 4200.541400.00 Infrastructure GS Construction, Inc 27,000.00 27,000.00 001901 North Metro Waste, Inc. I-630078 North Metro Waste, Inc. R 10/30/2015 020303 100 4200.522200.02 R&M - Street Maintenance North Metro Waste, I 1,100.00 1,100.00 001923 Divots Sportswear Co., Inc. I-261917 Divots Sportswear Co., Inc. R 10/30/2015 020304 100 0000.111900.00 Accounts Receivable Divots Sportswear Co 58.12 100 1110.531100.00 Supplies Divots Sportswear Co 332.74 100 1320.531100.00 Supplies Divots Sportswear Co 165.44 100 2650.531100.00 Supplies Divots Sportswear Co 236.45 100 1540.531100.00 Supplies Divots Sportswear Co 81.62 100 4100.531100.00 Supplies Divots Sportswear Co 50.87 100 0000.111900.00 Accounts Receivable Divots Sportswear Co 39.55 100 0000.111900.00 Accounts Receivable Divots Sportswear Co 1,235.72 2,200.51 001931 GA Public Safety Training Cent I-26-16-LBII15133 GA Public Safety Training Cent R 10/30/2015 020305 100 3200.531100.01 Supplies-Explorer Program GA Public Safety Tra 6,080.00 6,080.00 001932 WATERWORKS ATLANTA, INC. I-15-0558 WATERWORKS ATLANTA, INC. R 10/30/2015 020306 100 6200.522200.06 R&M-Parks WATERWORKS ATLANTA, 440.00 440.00 001933 Metro Green Recycling, L.L.C. I-16096 Metro Green Recycling, L.L.C. R 10/30/2015 020307 100 4200.522200.02 R&M - Street Maintenance Metro Green Recyclin 75.00 I-16280 Metro Green Recycling, L.L.C. R 10/30/2015 020307 100 4200.522200.02 R&M - Street Maintenance Metro Green Recyclin 175.00 250.00 001934 Police Executive Research Foru I-2086 Police Executive Research Foru R 10/30/2015 020308 211 3200.523700.00 Education & Training Police Executive Res 9,000.00 9,000.00 1 Assoc. of Nigerian Physicians I-ANPA Event Refund Assoc. of Nigerian Physicians: R 10/30/2015 020309 100 0000.321900.01 Other Licenses and permits Assoc. of Nigerian P 400.00 400.00 1 Stanley Convergent Security I-Corner Bakery Stanley Convergent Security: R 10/30/2015 020310 100 0000.323100.00 Bldg Structures & Equipment Stabey Convergent Se 304.12 304.12
SLIDE 52 11/16/2015 9:13 AM A/P HISTORY CHECK REPORT PAGE: 27 VENDOR SET: 01 City of Dunwoody, GA BANK: 03 Suntrust Disbursement Acc DATE RANGE:10/01/2015 THRU 10/31/2015 CHECK CHECK CHECK CHECK VENDOR I.D. NAME STATUS DATE AMOUNT DISCOUNT NO STATUS AMOUNT 1 HDP-Spruill, LLC I-OverpaidLDP14-8688 HDP-Spruill, LLC: R 10/30/2015 020311 100 0000.323100.00 Bldg Structures & Equipment HDP-Spruill, LLC: 24,997.00 24,997.00 1 Peachtree Charter Middle I-Sign Refund Peachtree Charter Middle: R 10/30/2015 020312 100 0000.127103.00 Special Event Sign Dep PayablePeachtree Charter Mi 100.00 100.00 1 Michelle Scharf I-Tour De Dunwoody Michelle Scharf: R 10/30/2015 020313 100 0000.127103.00 Special Event Sign Dep PayableMichelle Scharf: 100.00 100.00 * * T O T A L S * * NO INVOICE AMOUNT DISCOUNTS CHECK AMOUNT REGULAR CHECKS: 191 2,613,791.66 0.00 2,613,791.66 HAND CHECKS: 0 0.00 0.00 0.00 DRAFTS: 20 642,445.63 0.00 642,445.63 EFT: 0 0.00 0.00 0.00 NON CHECKS: 0 0.00 0.00 0.00 VOID CHECKS: 0 VOID DEBITS 0.00 VOID CREDITS 0.00 0.00 0.00 TOTAL ERRORS: 0 ** G/L ACCOUNT TOTALS ** G/L ACCOUNT NAME AMOUNT
- 100 0000.111900.00 Accounts Receivable 1,333.39
100 0000.121110.00 PCard A/P Control 64,877.14 100 0000.121300.12 EE-Vision Payable 481.34 100 0000.121300.15 POAB Deduction Payable 660.00 100 0000.121300.16 Flex Spending Ded Payable 749.34 100 0000.121300.18 AFLAC Deductions Payable 1,819.08 100 0000.123310.00 Abated Rent 87,449.74 100 0000.127103.00 Special Event Sign Dep Payable 1,000.00 100 0000.311700.00 Franchise Fees 52,074.13 100 0000.316100.00 Business & Occupation Tax 684.41 100 0000.321100.00 Alcoholic Beverage Licenses 3,312.78 100 0000.321900.01 Other Licenses and permits 4,000.00 100 0000.323100.00 Bldg Structures & Equipment 25,301.12 100 0000.347900.00 Pavilion Rentals 1,000.00 100 0000.381100.00 Rental Commissions 370.92 100 1110.512100.00 Group Insurance 4,508.97 100 1110.523200.00 Communications 213.83
SLIDE 53 11/16/2015 9:13 AM A/P HISTORY CHECK REPORT PAGE: 28 VENDOR SET: 01 City of Dunwoody, GA BANK: 03 Suntrust Disbursement Acc DATE RANGE:10/01/2015 THRU 10/31/2015 ** G/L ACCOUNT TOTALS ** G/L ACCOUNT NAME AMOUNT
- 100 1110.523600.00 Dues & Fees 450.00
100 1110.531100.00 Supplies 332.74 100 1320.512100.00 Group Insurance 3,643.44 100 1320.523200.00 Communications 274.68 100 1320.531100.00 Supplies 165.44 100 1320.531400.00 Books & Periodicals 138.96 100 1330.512100.00 Group Insurance 1,431.86 100 1330.523200.00 Communications 191.76 100 1511.512100.00 Group Insurance 2,148.19 100 1511.521100.01 Official/Admin Svcs 104,652.39 100 1511.521200.00 Professional Services 4,583.32 100 1511.521300.00 Technical Services 50.00 100 1511.523200.00 Communications 195.20 100 1512.521200.00 Professional Services 1,137.05 100 1512.522200.00 Repairs & Maintenance 723.51 100 1512.523200.00 Communications 131.89 100 1516.521300.00 Technical Services 50.00 100 1516.523200.00 Communications 2,716.99 100 1517.523200.00 Communications 19.38 100 1530.521200.01 Prof Svcs-Legal 12,500.00 100 1530.521200.02 Prof Svcs-Litigation 4,259.00 100 1530.523200.00 Communications 21.54 100 1535.521100.01 Official/Admin Svcs 38,173.50 100 1535.523200.00 Communications 397.20 100 1540.512100.00 Group Insurance 1,208.28 100 1540.512900.00 Other Employment Benefits 4,062.92 100 1540.521300.00 Technical Services 139.50 100 1540.523200.00 Communications 7.55 100 1540.523700.00 Education & Training 200.00 100 1540.531100.00 Supplies 81.62 100 1540.531400.00 Books & Periodicals 190.00 100 1565.522200.00 Repairs & Maintenance 2,123.95 100 1565.522300.00 Rentals 9,231.75 100 1565.531230.00 Electricity 1,521.19 100 1570.521100.01 Official/Admin Svcs 25,662.75 100 1570.521200.00 Professional Services 2,250.00 100 1570.531100.00 Supplies 125.99 100 2650.512100.00 Group Insurance 2,035.58 100 2650.521200.00 Prof Svcs 3,750.00 100 2650.521200.03 Prof Svcs-Court Solicitor 7,395.00 100 2650.521200.04 Prof Svcs-Public Defender 1,800.00 100 2650.521300.00 Technical Svcs 6,016.40 100 2650.522200.00 Repairs & Maintenance 1,815.00 100 2650.523200.00 Communications 437.80 100 2650.531100.00 Supplies 236.45 100 3200.512100.00 Group Insurance 77,149.77
SLIDE 54 11/16/2015 9:13 AM A/P HISTORY CHECK REPORT PAGE: 29 VENDOR SET: 01 City of Dunwoody, GA BANK: 03 Suntrust Disbursement Acc DATE RANGE:10/01/2015 THRU 10/31/2015 ** G/L ACCOUNT TOTALS ** G/L ACCOUNT NAME AMOUNT
- 100 3200.521200.00 Prof Svcs 626.00
100 3200.521300.00 Technical Svcs 1,608.05 100 3200.522200.00 Repairs & Maintenance 1,077.22 100 3200.522200.01 Repairs & Maintenance-Software 6,073.00 100 3200.522300.00 Rentals 1,456.37 100 3200.523200.00 Communications 14,188.12 100 3200.523300.00 Advertising 795.00 100 3200.523500.00 Travel 33.82 100 3200.523600.00 Dues & Fees 445.00 100 3200.523700.00 Education & Training 60.00 100 3200.531100.00 Supplies-General 26.00 100 3200.531100.01 Supplies-Explorer Program 6,080.00 100 3200.531100.04 Supplies - Operating 1,334.98 100 3200.531270.00 Gasoline 12,313.83 100 4100.512100.00 Group Insurance 2,095.51 100 4100.521100.01 Official/Admin Svcs 18,750.00 100 4100.521200.00 Prof Svcs 30,683.13 100 4100.523100.01 Claims 603.64 100 4100.523200.00 Communications 219.63 100 4100.523600.00 Dues & Fees 250.00 100 4100.531100.00 Supplies 50.87 100 4100.531230.00 Electricity 39,620.12 100 4200.521200.00 Prof Services 1,227.60 100 4200.522200.02 R&M - Street Maintenance 105,101.30 100 4200.522200.03 R&M - Traffic Signals 37,649.61 100 4200.522200.05 R&M - Right of Way Maint 1,666.66 100 4200.531100.00 Supplies 13,192.54 100 6200.521100.01 Official/Admin Svcs 16,900.00 100 6200.521200.00 Professional Services 810.00 100 6200.522200.06 R&M-Parks 43,219.80 100 6200.523100.00 Property/Liability Insurance 5,174.00 100 6200.523200.00 Communications 76.02 100 6200.531100.00 Supplies 7,760.50 100 6200.531230.00 Utilities 18,003.21 100 7000.521100.01 Official/Admin Svcs 132,250.00 100 7000.521300.00 Technical Svcs 16,641.25 100 7000.523100.01 Insurance Claims 2,700.00 100 7000.523200.00 Communications 321.09 100 7500.521200.00 Professional Services 2,500.00 100 7500.523300.00 Advertising 2,240.00 100 7500.523500.00 Travel 30.00 100 7500.531300.00 Food 118.74 *** FUND TOTAL *** 1,121,638.34 211 3200.523700.00 Education & Training 9,000.00 *** FUND TOTAL *** 9,000.00
SLIDE 55 11/16/2015 9:13 AM A/P HISTORY CHECK REPORT PAGE: 30 VENDOR SET: 01 City of Dunwoody, GA BANK: 03 Suntrust Disbursement Acc DATE RANGE:10/01/2015 THRU 10/31/2015 ** G/L ACCOUNT TOTALS ** G/L ACCOUNT NAME AMOUNT
- 212 0000.351320.00 Cash Confiscation 1,245.40
*** FUND TOTAL *** 1,245.40 215 3800.523200.00 Communications 12,583.80 215 3800.571000.00 Intergovernmental-E911 93,750.00 *** FUND TOTAL *** 106,333.80 250 4002.522200.12 Repairs & Maintenance - PTOP 251,293.81 250 4002.541400.14 TAP-Infrastructure 4,800.00 250 4006.541400.14 Bike Impl Plan-Infrastructure 25,413.68 *** FUND TOTAL *** 281,507.49 350 1565.541300.00 Buildings 22,941.00 350 4200.522200.00 Repairs & Maintenance 1,260,306.55 350 4200.541400.00 Infrastructure 234,444.13 350 6200.521200.00 Professional Services 3,145.00 350 6200.541200.00 Site improvements 11,343.65 350 6200.542000.00 Machinery & Equipment 65,000.00 *** FUND TOTAL *** 1,597,180.33 560 4320.521100.01 Official/Admin Svcs 8,333.17 560 4320.521200.09 Prof Svcs-Stormwater 28,887.86 560 4320.522200.00 Repairs & Maintenance 97,254.57 560 4320.531100.00 Supplies 2,106.33 *** FUND TOTAL *** 136,581.93 960 6200.541200.00 Site improvements 2,750.00 *** FUND TOTAL *** 2,750.00 NO INVOICE AMOUNT DISCOUNTS CHECK AMOUNT VENDOR SET: 01 BANK: 03 TOTALS: 211 3,256,237.29 0.00 3,256,237.29 BANK: 03 TOTALS: 211 3,256,237.29 0.00 3,256,237.29
SLIDE 56
11/16/2015 9:13 AM A/P HISTORY CHECK REPORT PAGE: 31 VENDOR SET: 01 City of Dunwoody, GA BANK: 05 Suntrust Municipal Court DATE RANGE:10/01/2015 THRU 10/31/2015 CHECK CHECK CHECK CHECK VENDOR I.D. NAME STATUS DATE AMOUNT DISCOUNT NO STATUS AMOUNT 000116 DeKalb County Finance Dept. I-August 2015 DeKalb County Finance Dept. R 10/02/2015 203361 745 0000.121800.00 Due to State Agencies DeKalb County Financ 4,697.36 4,697.36 000118 Peace Officers' I-Aug 2015 Peace Officers' R 10/02/2015 203362 745 0000.121800.00 Due to State Agencies Peace Officers' 5,002.93 5,002.93 000146 GSCCCA I-August 2015 GSCCCA R 10/02/2015 203363 745 0000.121800.00 Due to State Agencies GSCCCA 20,946.25 20,946.25 000278 DeKalb State Court I-D00044875 DeKalb State Court R 10/02/2015 203364 745 0000.121500.01 Jail Bonds Payable DeKalb State Court 350.00 350.00 000278 DeKalb State Court I-D00044876 DeKalb State Court R 10/02/2015 203365 745 0000.121500.01 Jail Bonds Payable DeKalb State Court 350.00 350.00 000278 DeKalb State Court I-D00045345 DeKalb State Court R 10/02/2015 203366 745 0000.121500.01 Jail Bonds Payable DeKalb State Court 350.00 350.00 000278 DeKalb State Court I-D00045626 DeKalb State Court R 10/02/2015 203367 745 0000.121500.01 Jail Bonds Payable DeKalb State Court 350.00 350.00 000278 DeKalb State Court I-D00046044 DeKalb State Court R 10/02/2015 203368 745 0000.121500.01 Jail Bonds Payable DeKalb State Court 350.00 350.00 001062 DeKalb Co Drug Abuse Treatment I-August 2015 DeKalb Co Drug Abuse Treatment R 10/02/2015 203369 745 0000.121800.00 Due to State Agencies DeKalb Co Drug Abuse 1,468.47 1,468.47 1 BRADY, CATHRYN ANNE I-000201509252961 BRADY, CATHRYN ANNE: R 10/02/2015 203370 745 0000.121500.01 Jail Bonds Payable Bond Refund:F35800 150.00 150.00 1 GARCIA, JENNY I-000201509252962 GARCIA, JENNY: R 10/02/2015 203371 745 0000.121500.01 Jail Bonds Payable Bond Refund:D0004315 350.00 745 0000.121500.01 Jail Bonds Payable Bond Refund:D0004315 350.00 700.00
SLIDE 57
11/16/2015 9:13 AM A/P HISTORY CHECK REPORT PAGE: 32 VENDOR SET: 01 City of Dunwoody, GA BANK: 05 Suntrust Municipal Court DATE RANGE:10/01/2015 THRU 10/31/2015 CHECK CHECK CHECK CHECK VENDOR I.D. NAME STATUS DATE AMOUNT DISCOUNT NO STATUS AMOUNT 1 HUDSON, LETA KALI I-000201509252963 HUDSON, LETA KALI: R 10/02/2015 203372 745 0000.121500.01 Jail Bonds Payable Bond Refund:D0004328 50.00 50.00 1 AMIRPOUR, DANIEL ALI I-000201509252964 AMIRPOUR, DANIEL ALI: R 10/02/2015 203373 745 0000.121500.01 Jail Bonds Payable Bond Refund:D0004562 50.00 745 0000.121500.01 Jail Bonds Payable Bond Refund:D0004562 250.00 745 0000.121500.01 Jail Bonds Payable Bond Refund:D0004562 178.00 478.00 1 VOAN, WILLIAM M I-000201509252965 VOAN, WILLIAM M: R 10/02/2015 203374 745 0000.121500.01 Jail Bonds Payable Bond Refund:D0004664 730.00 745 0000.121500.01 Jail Bonds Payable Bond Refund:D0004664 125.00 855.00 1 MONTERROSO REYES, ALMA A I-000201509252966 MONTERROSO REYES, ALMA A: R 10/02/2015 203375 745 0000.121500.01 Jail Bonds Payable Bond Refund:D0004665 500.00 745 0000.121500.01 Jail Bonds Payable Bond Refund:D0004665 730.00 1,230.00 1 TRAN, MINH CHAU I-000201509252967 TRAN, MINH CHAU: R 10/02/2015 203376 745 0000.121500.01 Jail Bonds Payable Bond Refund:D0004664 126.00 745 0000.121500.01 Jail Bonds Payable Bond Refund:D0004664 730.00 856.00 1 SELDON, TAMMIE I-000201509252968 SELDON, TAMMIE: R 10/02/2015 203377 745 0000.121500.01 Jail Bonds Payable Bond Refund:D0004684 150.00 745 0000.121500.01 Jail Bonds Payable Bond Refund:D0004684 230.00 380.00 1 SIDDARAJ, ROHAN I-000201509252969 SIDDARAJ, ROHAN: R 10/02/2015 203378 745 0000.121500.01 Jail Bonds Payable Bond Refund:D0004685 350.00 350.00 1 PORTER, WAUDELL I-000201509252970 PORTER, WAUDELL: R 10/02/2015 203379 745 0000.121500.01 Jail Bonds Payable Bond Refund:D0004696 350.00 350.00 1 GILL, ALLISON JOANN I-000201509252971 GILL, ALLISON JOANN: R 10/02/2015 203380 745 0000.121500.01 Jail Bonds Payable Bond Refund:D0004695 350.00 350.00 1 BELT, RANDA RENEE I-000201509252972 BELT, RANDA RENEE: R 10/02/2015 203381 745 0000.121500.01 Jail Bonds Payable Bond Refund:D0004705 350.00 350.00
SLIDE 58
11/16/2015 9:13 AM A/P HISTORY CHECK REPORT PAGE: 33 VENDOR SET: 01 City of Dunwoody, GA BANK: 05 Suntrust Municipal Court DATE RANGE:10/01/2015 THRU 10/31/2015 CHECK CHECK CHECK CHECK VENDOR I.D. NAME STATUS DATE AMOUNT DISCOUNT NO STATUS AMOUNT 000278 DeKalb State Court I-D00044012 DeKalb State Court R 10/16/2015 203382 745 0000.121500.01 Jail Bonds Payable DeKalb State Court 350.00 350.00 000278 DeKalb State Court I-D00044723 DeKalb State Court R 10/16/2015 203383 745 0000.121500.01 Jail Bonds Payable DeKalb State Court 350.00 350.00 000278 DeKalb State Court I-D00044746 DeKalb State Court R 10/16/2015 203384 745 0000.121500.01 Jail Bonds Payable DeKalb State Court 350.00 350.00 000278 DeKalb State Court I-D00044757-760 DeKalb State Court R 10/16/2015 203385 745 0000.121500.01 Jail Bonds Payable DeKalb State Court 2,150.00 2,150.00 000278 DeKalb State Court I-D00044858 DeKalb State Court R 10/16/2015 203386 745 0000.121500.01 Jail Bonds Payable DeKalb State Court 350.00 350.00 000278 DeKalb State Court I-D00044859 DeKalb State Court R 10/16/2015 203387 745 0000.121500.01 Jail Bonds Payable DeKalb State Court 350.00 350.00 000278 DeKalb State Court I-D00044928 DeKalb State Court R 10/16/2015 203388 745 0000.121500.01 Jail Bonds Payable DeKalb State Court 350.00 350.00 000278 DeKalb State Court I-D00044958 DeKalb State Court R 10/16/2015 203389 745 0000.121500.01 Jail Bonds Payable DeKalb State Court 350.00 350.00 000278 DeKalb State Court I-D00047014-15 DeKalb State Court R 10/16/2015 203390 745 0000.121500.01 Jail Bonds Payable DeKalb State Court 700.00 700.00 000278 DeKalb State Court I-D00047133 DeKalb State Court R 10/16/2015 203391 745 0000.121500.01 Jail Bonds Payable DeKalb State Court 350.00 350.00 000278 DeKalb State Court I-D0005129 DeKalb State Court R 10/16/2015 203392 745 0000.121500.01 Jail Bonds Payable DeKalb State Court 855.00 855.00
SLIDE 59
11/16/2015 9:13 AM A/P HISTORY CHECK REPORT PAGE: 34 VENDOR SET: 01 City of Dunwoody, GA BANK: 05 Suntrust Municipal Court DATE RANGE:10/01/2015 THRU 10/31/2015 CHECK CHECK CHECK CHECK VENDOR I.D. NAME STATUS DATE AMOUNT DISCOUNT NO STATUS AMOUNT 1 WILLIAMS, KENYETTA L I-000201510092973 WILLIAMS, KENYETTA L: R 10/16/2015 203393 745 0000.121500.01 Jail Bonds Payable Bond Refund:D0004001 22.00 22.00 1 ALLEN, DANIEL CAMERON I-000201510092974 ALLEN, DANIEL CAMERON: R 10/16/2015 203394 745 0000.121500.01 Jail Bonds Payable Bond Refund:D0004574 350.00 350.00 1 LOWRANCE, CAROLINE I-000201510092975 LOWRANCE, CAROLINE: R 10/16/2015 203395 745 0000.121500.01 Jail Bonds Payable Bond Refund:D0004705 350.00 350.00 1 NEUMAN, TIMOTHY ANDREW I-000201510092976 NEUMAN, TIMOTHY ANDREW: R 10/16/2015 203396 745 0000.121500.01 Jail Bonds Payable Bond Refund:D0004713 350.00 350.00 1 JAMES, TONYA IESHA I-000201510092977 JAMES, TONYA IESHA: R 10/16/2015 203397 745 0000.121500.01 Jail Bonds Payable Bond Refund:D0004711 700.00 700.00 1 HERNDON, JOSEPH LEE I-000201510092978 HERNDON, JOSEPH LEE: R 10/16/2015 203398 745 0000.121500.01 Jail Bonds Payable Bond Refund:D0004718 606.00 745 0000.121500.01 Jail Bonds Payable Bond Refund:D0004718 730.00 1,336.00 1 GROVE, ELGIN LAMAR I-000201510092979 GROVE, ELGIN LAMAR: R 10/16/2015 203399 745 0000.121500.01 Jail Bonds Payable Bond Refund:20801 350.00 350.00 1 SANCHEZ, ARELY SANCHEZ I-000201510092980 SANCHEZ, ARELY SANCHEZ: R 10/16/2015 203400 745 0000.121500.01 Jail Bonds Payable Bond Refund:D0004730 730.00 730.00 1 GARCIA-MARCELO, GLADIS I-000201510092981 GARCIA-MARCELO, GLADIS: R 10/16/2015 203401 745 0000.121500.01 Jail Bonds Payable Bond Refund:D0004737 50.00 50.00 1 LEE, TERRELL DEVON I-000201510092982 LEE, TERRELL DEVON: R 10/16/2015 203402 745 0000.121500.01 Jail Bonds Payable Bond Refund:D0004741 80.00 80.00 1 Yin, Kevin Chi Yen I-Kevin Chi Yen Yin Yin, Kevin Chi Yen: R 10/16/2015 203403 745 0000.121500.01 Jail Bonds Payable Yin, Kevin Chi Yen: 350.00 350.00
SLIDE 60
11/16/2015 9:13 AM A/P HISTORY CHECK REPORT PAGE: 35 VENDOR SET: 01 City of Dunwoody, GA BANK: 05 Suntrust Municipal Court DATE RANGE:10/01/2015 THRU 10/31/2015 CHECK CHECK CHECK CHECK VENDOR I.D. NAME STATUS DATE AMOUNT DISCOUNT NO STATUS AMOUNT 1 Lindsey M Ruiz I-Lindsey Ruiz Lindsey M Ruiz: R 10/16/2015 203404 745 0000.121500.01 Jail Bonds Payable Lindsey M Ruiz: 380.00 380.00 000115 DeKalb County Jail I-June 2015 DeKalb County Jail R 10/23/2015 203405 745 0000.121800.00 Due to State Agencies DeKalb County Jail 11.18 11.18 000116 DeKalb County Finance Dept. I-June 2015 DeKalb County Finance Dept. R 10/23/2015 203406 745 0000.121800.00 Due to State Agencies DeKalb County Financ 4,395.55 4,395.55 000118 Peace Officers' I-Jun 2015 Peace Officers' R 10/23/2015 203407 745 0000.121800.00 Due to State Agencies Peace Officers' 4,838.90 4,838.90 000146 GSCCCA I-June 2015 GSCCCA R 10/23/2015 203408 745 0000.121800.00 Due to State Agencies GSCCCA 19,959.08 19,959.08 001062 DeKalb Co Drug Abuse Treatment I-June 2015 DeKalb Co Drug Abuse Treatment R 10/23/2015 203409 745 0000.121800.00 Due to State Agencies DeKalb Co Drug Abuse 845.13 845.13 000278 DeKalb State Court I-D00042780 DeKalb State Court R 10/30/2015 203410 745 0000.121500.01 Jail Bonds Payable DeKalb State Court 1,050.00 1,050.00 000278 DeKalb State Court I-D00045441 DeKalb State Court R 10/30/2015 203411 745 0000.121500.01 Jail Bonds Payable DeKalb State Court 350.00 350.00 000278 DeKalb State Court I-D00046003 DeKalb State Court R 10/30/2015 203412 745 0000.121500.01 Jail Bonds Payable DeKalb State Court 350.00 350.00 000278 DeKalb State Court I-D00046392 DeKalb State Court R 10/30/2015 203413 745 0000.121500.01 Jail Bonds Payable DeKalb State Court 350.00 350.00 1 FRICKS, CARLA DIANE I-000201510262983 FRICKS, CARLA DIANE: R 10/30/2015 203414 745 0000.121500.01 Jail Bonds Payable Bond Refund:D0004583 350.00 350.00
SLIDE 61
11/16/2015 9:13 AM A/P HISTORY CHECK REPORT PAGE: 36 VENDOR SET: 01 City of Dunwoody, GA BANK: 05 Suntrust Municipal Court DATE RANGE:10/01/2015 THRU 10/31/2015 CHECK CHECK CHECK CHECK VENDOR I.D. NAME STATUS DATE AMOUNT DISCOUNT NO STATUS AMOUNT 1 RODRIGUEZ, EVELIO ISRAEL I-000201510262984 RODRIGUEZ, EVELIO ISRAEL: R 10/30/2015 203415 745 0000.121500.01 Jail Bonds Payable Bond Refund:D0004588 1,375.00 1,375.00 1 MARTINEZ-GARCIA, JOSE MARTIN I-000201510262985 MARTINEZ-GARCIA, JOSE MARTIN: R 10/30/2015 203416 745 0000.121500.01 Jail Bonds Payable Bond Refund:D0004591 400.00 400.00 1 HILL, THOMAS A I-000201510262986 HILL, THOMAS A: R 10/30/2015 203417 745 0000.121500.01 Jail Bonds Payable Bond Refund:D0004734 350.00 350.00 1 WILLIAMS, MIKKI I-000201510262987 WILLIAMS, MIKKI: R 10/30/2015 203418 745 0000.121500.01 Jail Bonds Payable Bond Refund:D0004019 350.00 745 0000.121500.01 Jail Bonds Payable Bond Refund:F40198 200.00 550.00 1 ROBERTS, MARVIN I-000201510262988 ROBERTS, MARVIN: R 10/30/2015 203419 745 0000.121500.01 Jail Bonds Payable Bond Refund:D0004621 350.00 350.00 1 THOMPSON, PAUL GREGORY I-000201510262989 THOMPSON, PAUL GREGORY: R 10/30/2015 203420 745 0000.121500.01 Jail Bonds Payable Bond Refund:D0004749 250.00 250.00 1 ALMENDAREZ CACERES, REINA M I-000201510262990 ALMENDAREZ CACERES, REINA M: R 10/30/2015 203421 745 0000.121500.01 Jail Bonds Payable Bond Refund:D0004762 100.00 100.00 1 LAW, SHANNON SADE I-000201510262991 LAW, SHANNON SADE: R 10/30/2015 203422 745 0000.121500.01 Jail Bonds Payable Bond Refund:D0004770 200.00 200.00 1 YANCY, SHANNON D I-000201510262992 YANCY, SHANNON D: R 10/30/2015 203423 745 0000.121500.01 Jail Bonds Payable Bond Refund:D0004773 350.00 350.00 1 OZGENC, HALIL IBRAHIM I-000201510262993 OZGENC, HALIL IBRAHIM: R 10/30/2015 203424 745 0000.121500.01 Jail Bonds Payable Bond Refund:D0004781 126.00 126.00 1 WATSON, MICHAEL SHAQUAN I-000201510262994 WATSON, MICHAEL SHAQUAN: R 10/30/2015 203425 745 0000.121500.01 Jail Bonds Payable Bond Refund:D0004019 350.00 745 0000.121500.01 Jail Bonds Payable Bond Refund:D0004019 350.00CR 745 0000.121500.01 Jail Bonds Payable Bond Refund:D0004019 350.00 745 0000.121500.01 Jail Bonds Payable Bond Refund:D0004019 350.00CR 745 0000.121500.01 Jail Bonds Payable Bond Refund:D0004019 350.00 350.00
SLIDE 62 11/16/2015 9:13 AM A/P HISTORY CHECK REPORT PAGE: 37 VENDOR SET: 01 City of Dunwoody, GA BANK: 05 Suntrust Municipal Court DATE RANGE:10/01/2015 THRU 10/31/2015 CHECK CHECK CHECK CHECK VENDOR I.D. NAME STATUS DATE AMOUNT DISCOUNT NO STATUS AMOUNT 1 TILLIS, ESSENCE I-000201510262995 TILLIS, ESSENCE: R 10/30/2015 203426 745 0000.121500.01 Jail Bonds Payable Bond Refund:D0004769 50.00 745 0000.121500.01 Jail Bonds Payable Bond Refund:D0004769 50.00CR 745 0000.121500.01 Jail Bonds Payable Bond Refund:D0004769 50.00 50.00 * * T O T A L S * * NO INVOICE AMOUNT DISCOUNTS CHECK AMOUNT REGULAR CHECKS: 66 88,467.85 0.00 88,467.85 HAND CHECKS: 0 0.00 0.00 0.00 DRAFTS: 0 0.00 0.00 0.00 EFT: 0 0.00 0.00 0.00 NON CHECKS: 0 0.00 0.00 0.00 VOID CHECKS: 0 VOID DEBITS 0.00 VOID CREDITS 0.00 0.00 0.00 TOTAL ERRORS: 0 ** G/L ACCOUNT TOTALS ** G/L ACCOUNT NAME AMOUNT
- 745 0000.121500.01 Jail Bonds Payable 26,303.00
745 0000.121800.00 Due to State Agencies 62,164.85 *** FUND TOTAL *** 88,467.85 NO INVOICE AMOUNT DISCOUNTS CHECK AMOUNT VENDOR SET: 01 BANK: 05 TOTALS: 66 88,467.85 0.00 88,467.85 BANK: 05 TOTALS: 66 88,467.85 0.00 88,467.85
SLIDE 63 11/16/2015 9:13 AM A/P HISTORY CHECK REPORT PAGE: 38 VENDOR SET: 01 City of Dunwoody, GA BANK: 06 PNC Municipal Court Cash DATE RANGE:10/01/2015 THRU 10/31/2015 CHECK CHECK CHECK CHECK VENDOR I.D. NAME STATUS DATE AMOUNT DISCOUNT NO STATUS AMOUNT 001168 City of Dunwoody I-August 2015 City of Dunwoody R 10/16/2015 000029 745 0000.121900.01 Due to Other Funds-100 (SYS) City of Dunwoody 17,013.36 I-September 2015 City of Dunwoody R 10/16/2015 000029 745 0000.121900.01 Due to Other Funds-100 (SYS) City of Dunwoody 18,530.46 35,543.82 * * T O T A L S * * NO INVOICE AMOUNT DISCOUNTS CHECK AMOUNT REGULAR CHECKS: 1 35,543.82 0.00 35,543.82 HAND CHECKS: 0 0.00 0.00 0.00 DRAFTS: 0 0.00 0.00 0.00 EFT: 0 0.00 0.00 0.00 NON CHECKS: 0 0.00 0.00 0.00 VOID CHECKS: 0 VOID DEBITS 0.00 VOID CREDITS 0.00 0.00 0.00 TOTAL ERRORS: 0 ** G/L ACCOUNT TOTALS ** G/L ACCOUNT NAME AMOUNT
- 745 0000.121900.01 Due to Other Funds-100 (SYS) 35,543.82
*** FUND TOTAL *** 35,543.82 NO INVOICE AMOUNT DISCOUNTS CHECK AMOUNT VENDOR SET: 01 BANK: 06 TOTALS: 1 35,543.82 0.00 35,543.82 BANK: 06 TOTALS: 1 35,543.82 0.00 35,543.82 REPORT TOTALS: 283 4,557,680.85 0.00 4,557,930.85
SLIDE 64 11/16/2015 9:13 AM A/P HISTORY CHECK REPORT PAGE: 39 SELECTION CRITERIA
- VENDOR SET: 01-City of Dunwoody
VENDOR: ALL BANK CODES: All FUNDS: All
CHECK RANGE: 000000 THRU 999999 DATE RANGE: 10/01/2015 THRU 10/31/2015 CHECK AMOUNT RANGE: 0.00 THRU 999,999,999.99 INCLUDE ALL VOIDS: YES
SEQUENCE: CHECK NUMBER PRINT TRANSACTIONS: YES PRINT G/L: YES UNPOSTED ONLY: NO EXCLUDE UNPOSTED: YES MANUAL ONLY: NO STUB COMMENTS: NO REPORT FOOTER: NO CHECK STATUS: NO PRINT STATUS: * - All