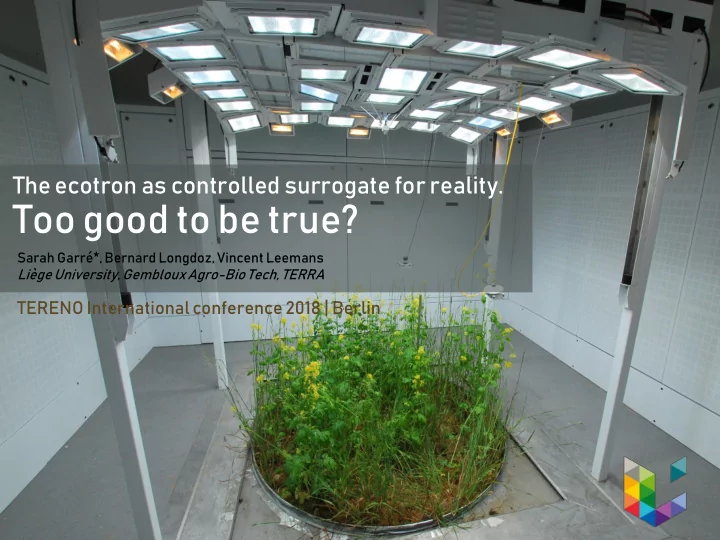
SLIDE 1 The ecotron as controlled surrogate for reality.
Too good to be true?
Sarah Garré*, Bernard Longdoz, Vincent Leemans Liège University, Gembloux Agro-Bio Tech, TERRA
TERENO International conference 2018 | Berlin
SLIDE 2 Drawing graphic acknowledgements PhD
SLIDE 3
How adapt to climate change?
SLIDE 4
How can we preserve ecosystems and the services they deliver?
SLIDE 5
Ecotron Uhasselt, Belgium
SLIDE 6
SLIDE 7
Design new ecosystems?
SLIDE 9 SCALE GAP
8.5 cm
Intertwined processes
SLIDE 10 SCALE GAP
8.5 cm
Intertwined processes MODELS?
SLIDE 11 SCALE GAP
8.5 cm
Intertwined processes ECOTRON?
SLIDE 12
Downscaling Upscaling
MODELS +
Calibration Model improvement Experimental design
SLIDE 13
« An ECOTRON is a facility where ecosystems are confined in experimental chambers, allowing the simultaneous control of environmental conditions and the on-line monitoring of processes »
SLIDE 14 ECOTRON
a tool to quantify the effect
climate on our reality
SLIDE 15 Controlled atmosphere CO2, O3, T, RH, Rainfall Net flux of CO2, H2O, sensible heat (near future) Full light spectrum intensity of max 1200 μmole photons/m²/s Rainfall intensity min 0,2 l/min; max 7 l/min Wind: 0,1 et 0,3 m/s 2m² x 1.5m Plant: Winter wheat Technical itinerary: 180 kgN/ha, 3 fractions Reconstructed soil (at present): 2 horizons, 3m³, cutanic Luvisol (colluvic) Soil T and h controlled Sensors: T, WC, h, soil solution, total weight
SLIDE 16
Possibility to reach tipping points (resilience limits) by increasing a constraint High number of controlled variables Measurement of process & state variables
SLIDE 17
Experiment 0
Field 2015 ICOS labelled site, Lonzée BE Ecotron 2015 Meteorological conditions 2015 Ecotron 2091 +2°C +50% CO2+300 PPM
#3 #3
SLIDE 18
Experiment 0
Field 2015 ICOS labelled site, Lonzée BE Ecotron 2015 Meteorological conditions 2015 Ecotron 2091 +2°C +50% CO2+300 PPM
#3 #3
SLIDE 19
Experiment 0
Field 2015 ICOS labelled site, Lonzée BE Ecotron 2015 Meteorological conditions 2015 Ecotron 2091 +2°C +50% CO2+300 PPM
#3 #3
0.1 Ecotron = surrogate reality?
SLIDE 20 Experiment 0.1 Possible bottlenecks
- Reproduction of wind and resulting turbulence
- Thermal infra-red inputs from walls >< clear sky
- Light intensity is limited to 1200 μmole photons.m-2.s-1
- Reconstructed soil (repacked horizons as in the field)
SLIDE 21 No wind
Carlson et al. Simsphere Model work book
SLIDE 22
No radiative sky cooling DAY NIGHT
SLIDE 23
Intensity solar radiation
Max ecotron = close to max photosynthesis
SLIDE 24
Repacked soil
SLIDE 25
Quantify impact of these bottlenecks with adapted models
STICS | crop PASIM | pasture Coupled with ASPECT (atmosphere flux model) Impact soil structure: HYDRUS
SLIDE 26
Experiment 0
Field 2015 ICOS labelled site, Lonzée BE Ecotron 2015 Meteorological conditions 2015 Ecotron 2091 +2°C +50% CO2+300 PPM
#3 #3
0.2 How does the average future climate differ from an average current climate?
SLIDE 27
Experiment 0
Field 2015 ICOS labelled site, Lonzée BE Ecotron 2015 Meteorological conditions 2015 Ecotron 2091 +2°C +50% CO2+300 PPM
#3 #3
SLIDE 28
Experiment 0.2
Ecotron 2015 Meteorological conditions 2015 Ecotron 2091 +2°C +50% CO2+300 PPM
#3 #3
Test ability of crop models to predict crop growth under current and future climate
SLIDE 29
Conclusion
SLIDE 30 Want to use the ecotron or its data?
www.terra.uliege.be
Bernard.longdoz@uliege.be Vincent LEEMANS Vincent.Leemans@uliege.be
SLIDE 31 Thanks to the whole team preparing the first TERRA ecotron experiment
Vincent Leemans Cathérine Ghymers Bernard Longdoz Bernard Heinesch Pierre Delaplace Benjamin Dumont JT Cornélis Gilles Colinet Sebastien Massart Bernard Bodson Julien Fouché Aurore Degré François Verheggen ….