
SLIDE 1
The Southeastern Pecan Industry Past, Present , and Future
Bill Goff Nunn-Bond Professor Emeritus Department of Horticulture Auburn University goffwil@auburn.edu
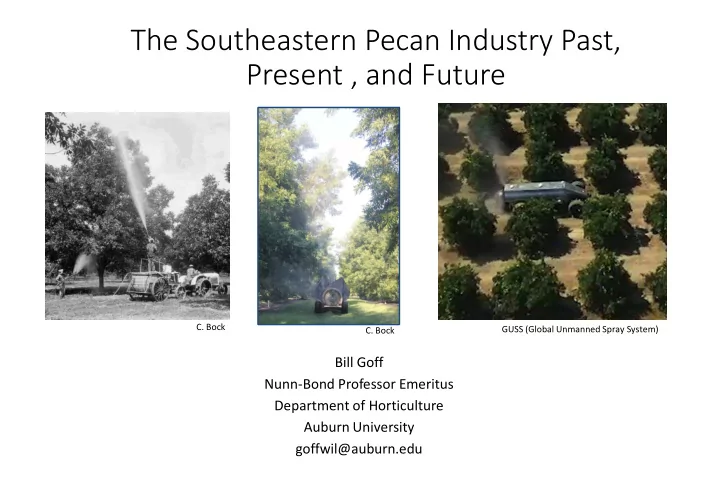
- C. Bock
- C. Bock
GUSS (Global Unmanned Spray System)