
SLIDE 1
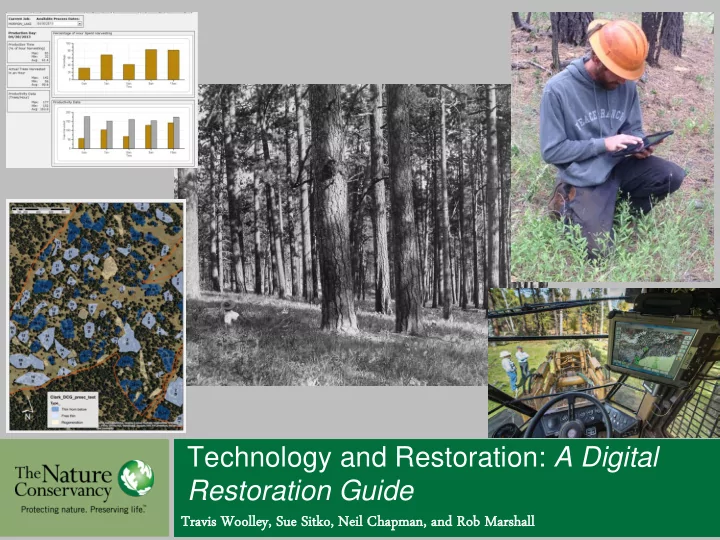
Technology and Restoration: A Digital Restoration Guide
Travi vis Wool Woolley, S Sue S Sitko,
- , Neil
il C Chapman, n, and R d Rob Marshall
Technology and Restoration: A Digital Restoration Guide Travi vis - - PowerPoint PPT Presentation
Technology and Restoration: A Digital Restoration Guide Travi vis Wool Woolley, S Sue S Sitko, o, Neil il C Chapman, n, and R d Rob Marshall Background Accelerate the pace and scale of forest restoration in Northern Arizona Planning
Technology and Restoration: A Digital Restoration Guide
Travi vis Wool Woolley, S Sue S Sitko,
il C Chapman, n, and R d Rob Marshall
Accelerate the pace and scale
Arizona
Planning scale - 2.4 million acre landscape Signed EIS/ROD for 586,110 acres
Environmental Analysis Layout Monitoring & Adaptive Management Planning Implementation
(DxP) up to 75% of treatments
based restoration
structure
the field on handheld devices
Team testing for easement monitoring
resource importance
for plot data
archeological sites, etc.
between specialists
prescriptions
handheld tablets to digitally mark tree groups
Digital Tree Marking Inputs
Digital Tree Marking Inputs
tree group
Digital Tree Marking Inputs
tree group
resource specialist activities
prescriptions
marking data and track productivity
$40/acre $16/acre
8 acres/day/person 40-60 acres/day/person
prescritpions
information
the next 6 months (Fort Valley Task Order)
Stewardship Agreement
10,000 acre project area
meaningful feedback for adaptive management (TRUST!)
1. Develop capabilities to measure tree size during harvest
data with remote sensing data to assess post-treatment landscape