
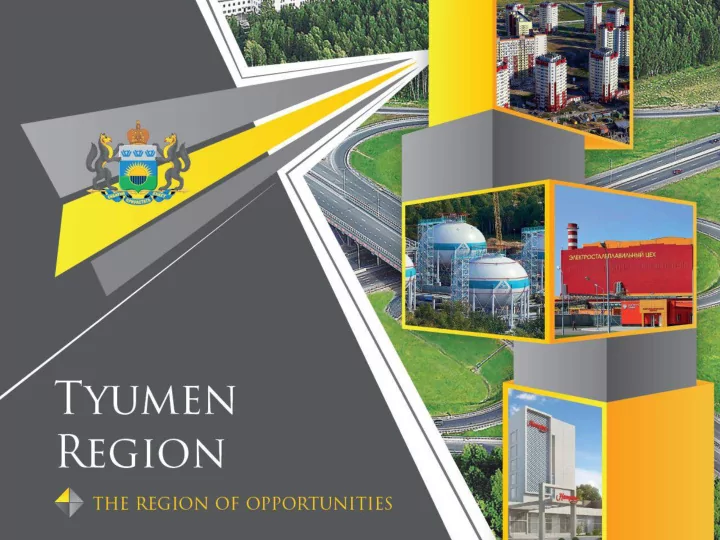
SLIDE 1
1
The real Siberia 1 Tyumen region is a leader of national rating of - - PowerPoint PPT Presentation
The real Siberia 1 Tyumen region is a leader of national rating of the investment climate in 2018. Thousands of Regions Indicators entrepreneurs WHAT IS THE TYUMEN REGION? The Tyumen region is the connecting link between The region is
1
The Moscow-Vladivostok road that runs through the region also forms part of the Berlin-Beijing corridor. The trans-Siberian railway connects the area with other regional centers of Russia. There are regular direct international flights from Roshino airport (Tyumen) to Germany, Azerbaijan, Uzbekistan, Armenia and Tajikistan, as well as 10 flights to Moscow daily. The flight time to Moscow is 2 hours and 40 minutes.
The region has Russia's largest reserves of peat (2.6 billion tons). There are 37 active hydrocarbon
volume in the South of the region is estimated at 1.8 billion tons. Timber reserves are estimated at 924 million cubic meters. Potential harvest volume is up to 15.6 million cubic meters per year. There is a significant source
thousand cubic meters per day) in the region. There are substantial reserves of mortar sand (442 million cubic meters) and clay (397 million cubic meters).
The Tyumen region is the connecting link between the East and West and it is the oil and gas industrial region in the North and the Urals. The region is inherently strategic because it is the shortest access route to the largest oil, gas and infrastructure projects
districts.
INDUSTRIALIZATION OF THE ECONOMY IN ACTION In the past 10 years, 49 large companies have been opened in the region. National rating The Tyumen region is the leader in the rating of the investment climate in the constituent entities of the Russian Federation in 2018. COMPLEX FINANCIAL SUPPORT TAX INCENTIVES Reduction of the regional component of the income tax by 3%; Decrease of the corporate property tax rates (0% for 3 years from the date of commissioning an enterprise in any type of processing industry, if the total investment is over 300 million rubles); Provision of various tax benefits from land and transport taxes; System of investment loans at 3% for five years. INDUSTRIAL PARK Platform for the creation of industrial parks, which have a principle of «3 in 1» (ready communication, tax exemption system and governmental support, and cheap rent). PROFESSIONAL SUPPORT AND MAINTENANCE “FULL CONSTRUCTION” FOR ORGANIZATION AND BUSINESS DEVELOPMENT Administrative support of investment projects, regardless of the amount of investments. AVAILABILITY OF ADVANCED RESEARCH CENTERS AND A HIGH CONCENTRATION OF SCIENTIFIC CLUSTERS The region has over 40 scientific research institute. HIGH SOLVENCY OF THE POPULATION AND LIVING STANDARTS DEVELOPED INFRASTRUCTURE OF QUALITY STAFF TRAINING
We have major oil and gas companies and research institutes located in the region: Major international and Russian companies trust us:
410,9 464,8 547,5 730,6 801,5 927,4 2006 2008 2010 2012 2014
Gross Regional Product increased more than 2 times in current prices
Billion rubles
2016
rating*
*The rating was refined in the framework of the formation of the forecast for the social and economic development of the Tyumen Region (without autonomous districts) for 2018 and for the planned period of 2019 and 2020 (sent to the Ministry
Gross Regional Product increased more than 2 times in current prices
The rating was refined in the framework of the formation of the forecast for the social and economic development of the Tyumen Region (without autonomous districts) for 2018 and for the planned period of 2019 and 2020 (sent to the Ministry of Economic Development of Russia by letter №05/8745м/17-4534, dated by July, 18, 2017)
Billions RUB
100 115,3 152,9 201,6 262 300,9
2010 2012 2014 2016 2006
Oil refinery Petrochemical industry Ferrous metallurgy Glass production Biotechnological production
New industrial sectors % as compared
to 2006
2008
According to the results of 2017— 102,6% As of May 2018 — 108,1% (In the manufacturing industry — 111%)
% as compared to 2006
87,6 143,3 154,8 204,9 248,2 261,5 2006 2008 2010 2012 2014
2015 (in comparable prices)
Billion rubles
2016
67,4% - industry 45,8% - manufacturing Composition of investment in 2016 (without SMEs):
The investment volume for the indicated period has grown in 3 times (in current prices)
Increase on 19,9% in 2017 compared to 2016 ( in comparable prices)
Billions RUB
Republic of Korea– 1,9 mln. US dollars Turkey – 99,2 mln. US dollars Great Britain – 213,5 mln. US dollars
In 2017, the main export deliveries of goods were carried out in 76 countries
Canada – 3,3 mln. US dollars Italy – 2,1 mln. US dollars Mongolia – 3,5
USA – 14,4 mln. US dollars Finnland – 117,1
Netherlands – 817,2
Sweden – 178,3 mln. US dollars Latvia – 155,9 mln. US dollars China - 38,1 mln. US dollars Belgium – 354,8
Belorussia – 143,2
France – 264,9
Germany – 92,5
Kazahstan – 86,4
In 2017, in the Tyumen region, an export growth of nearly a billion dollars was recorded. (In 2017, it amounted to $ 2,940.2 million, which is 1.4 times more compared to the results of 2016 - $ 2,052.5 million) At the end of 2017, there was an increase in exports of petrochemical products, food products and agricultural raw materials by 11%, wood products by 34.7%, industrial textiles - almost doubled.
542,9 1139,1 913,8 2128,4 2052,5 2940,2 2007 2010 2014 2015 2016 2017
ИНДЕКС ПРОМЫШЛЕННОГО ПРОИЗВОДСТВА ВЫРОС В 3 РАЗА
CONSTRUCTION MATERIALS FOOD INDUSTRY WOOD INDUSTRY MACHINERY, OIL AND GAS SERVICES OIL AND GAS INDUSTRY TORISM, MEDICINE
10
10
In the last 10 years, 500 km of regional and municipal highways and 47 bridges have been built or
thousand km of highways of regional and local using. For several years, the region has been the leader in the volume of housing per person, regularly exceeding the national average and average of the Ural Federal district by 1.5-2 times. (In 2015, the amount of housing per person averaged 1.48 square meters in the Tyumen region.) The region achieved the directive of the President of the Russian Federation in 2013 by meeting the objective
2020. The reconstruction of the Roshino International Airport was recently completed.
INFRASTRUCTURE DEVELOPMENT
Integrated financial support. What does it mean in practice?
Administrative support We offer municipal sites, industrial park sites with ready engineering infrastructure. Ready -made recreational facilities, industrial sites for the implementation of projects. Reduce the regional part of the income tax rate by 3% Reduce the rate of property tax (0% for 3 years from the date of commissioning an enterprise in any type of processing industry, if the total investment is over 300 million rubles) We provide various tax benefits from land and transport taxes We provide up to 50% compensation for the costs of engineering infrastructure development Investment loans at 3% for investment projects, loans at 0% for residents of the Bogadinsky industrial park. We subsidize the first installment of equipment leasing (up to 50% of the equipment costs) and % rate on lease payments and also % rate on loans
Leasing at a reduce rate — 3% per annum
Assistance in
permits (document ation) Assistance with registration of land plots SUPPORT OF INVESTMENT PROJECTS ADMINISTRATIVE SUPPORT ACCORDING TO THE “ONE-STOP SHOP” Currently in the registry of investment projects of the Tyumen region, there are more than 600 projects with an investment volume of more than 1.6 trillion rubles.
ADMINISTRATIVE SUPPORT FOR INVESTORS
In order to develop the economies of municipalities there were created plans, including locomotive investment projects and sites for their implementation. There were formed project groups, which included representatives of the regional government, local government bodies and the Investment Agency of the Tyumen Region
Правительство тюменской области www/admtyumen.ru Департамент инвестиционной политики и государственной поддержки предпринимательства Тюменской области www.tyumen-region.ru
www.iato.ru
Financial support Monitoring procedures for preparation and implementation of investment projects Assistance in access to Infrastructure (technological connection) Organization of cooperation with municipalities for the implementation
THE CREATION OF THE INDUSTRIAL PARK AND THE ECONOMIC DEVELOPMENT ZONE IN TUYMEN REGION
Industrial parks
infrastructure
rubles per hectare;
providing multiple services.
Economic development zones
for residents for a few years.
Financial support
Subsidizing the first installment of leasing equipment, investment loans at 3% and at 0%
2 hа, ООО TPK «Yadogy Plus» 1,2 hа 2 hа, ООО «Rost Grib»
ООО «Tyumen Pribor»
1,4 hа
1,9 hа 3,1 hа 2 hа 1 hа 2 hа ООО «Landis» ООО «Magia Vkusa» ООО «Provans» ООО «EnergoTechServis» ООО «NG-Grupp» ООО «SibBurMash»
Water supply/Drainage system
500 m3/day
Electricity Supply
4 megawatt
Gas Supply
380 m3/h
Highways
Highways about 1,5 km were built
coating is planned for 2018.
4 megawatt
3,4 hа 5 hа 1,7 hа АО NPО «Novodez» ООО PF «PolimerPlast»
Water supply/Drainage system
Capacity: 1000 m3/day 600 m3/day
Electricity Supply
4,9 megawatt( 30 megawatt in 2018 )
Gas Supply
1200 m3/h
Highways
7 km
Capacity: 1000 m3/day 600 m3/day 4,9 megawatt( 30 megawatt in 2018 )
The building area of 135,000 square meters
The total land area is 23 hectares There is possibility of connection to engineering communications There is a convenient system of access routes, including railway siding This territory is guarded by security office
Volume: 2000 m3/day 2000 m3/day 4,9 МВт 1200 m3/hour
Electricity Supply Water supply/Drainage system Gas Supply
Capacity of 2 million tons per year with the relevant facilities of the plant (Zapsibneftekhim-2).
Was opened: October 15th, 2013. Project implementation period: 2015-2025
West-Siberian complex of high- level processing of hydrocarbon raw materials into polyolefins.
billion billion billion billion billion
Complex of production of propylene by dehydrogenation of propane and polypropylene capacity of 500 tons Construction
Balyksky gas pipeline "Tobolsk- Neftekhim"
"Tobolsk-Polymer": production of 500 thousand tons of polypropylene per year. Administrative support:
Expansion of the NGL processing complex with a capacity of at least 5.8 million tons per year. Development of railway infrastructure of non-common ways
Neftekhim LLC in Tobolsk.
To ensure the export of products of JSC "SIBUR Holding" Tobolsk area (2012-2018). Completed. Completed. Completed.
billions
billions billions billions
"Tobolsk-Polymer": production of 500 thousand tons of polypropylene per year.
Complex of production
dehydrogenation of propane and polypropylene capacity
Completed in 2013 Construction of the South- Balyksky gas pipeline "Tobolsk- Neftekhim"
Completed in 2014
Expansion of the NGL processing complex with a capacity of at least 5.8 million tons per year.
Completed in 2014 Administrative support:
accompaniment .
Development of railway infrastructure
LLC in Tobolsk.
Completed in 2015 Ensure the export of products "Sibur Holding" from the Tobolsk area
The development of the Antipinsky industrial hub. Antipinsky Oil Refinery achieved a refining depth of 98%, a record for Russia. Start of construction: 2005. 1st phase was commissioned: 2006. 2nd phase was commissioned: 2010. 3rd phase: in progress. 4th phase: in plan Production volume: 9 million tons per year. State aid: Tax exemptions; Administrative support. Production of 300 mln. glass bottles per year. The only high-tech glass production company in the Urals Federal District. State aid: Tax exemptions; Subsidizing part of the costs; Administrative support. Production of submersible pumps and accessories for perforation equipment. The company actively cooperates with the representatives of small and medium-sized oil and gas companies. Siberian Training Center. State aid: Tax exemptions; Subsidizing part of the costs; Administrative support. Specialized in the production of metal goods for rail, pedestrian and combined bridges, steel sheet panels, as well as construction metaware. The factory allows to produce up to 45 000 tons of steel per year. State aid: Tax exemptions; Subsidizing part of the costs; Administrative support.
DEVELOPMENT OF THE TYUMEN INDUSTRIAL HUB
million
billion
billion
billion
Antipinsky Oil Refinery Steklotech Factory Tyumenstal Most Factory Schlumberger
UMMC billion
Metallurgical plant for the production of mill products. The iron and steel industries are one of the strategic directions of activity of UMMC. In 2013, the company completed the construction of a new steel plant in Tyumen. The performance of the plant is 550 thousand tons of metal per year. In 2.4 years, the plant «UMMC-Steel» produced 1 million tons of steel. UMMC was opened: July 24th, 2013. State aid: Tax exemptions; Co-financing the construction of the substation; Administrative support.
DEVELOPMENT OF THE TYUMEN INDUSTRIAL HUB
Ochakovo is one of the biggest alimentary companies in Siberia. Wide range of beverages – approximately 10 types of beer and 4 sorts of “kvas”. Produces 120 mln. liters of bear and 45 mln. liters of “kvas” per year. State aid: Tax exemptions;
\Administrative support.
5 types and 11 grades of plywood. 90 thousand m3 of plywood per year. More than 100 customers from 35 countries. 84% of productions are exported in 30 countries. The 1st stage was opened on December 18th, 2009. The second stage was opened on July 30th, 2013 State aid: Tax exemptions; Subsidizing part of the costs; Administrative support. Metallurgical plant for the production of mill products. The iron and steel industries are one of the strategic directions of activity of UMMC. In 2013, the company completed the construction
The performance of the plant is 550 thousand tons of metal per year. In 2.4 years, the plant «UMMC-Steel» produced 1 million tons of steel. UMMC was opened: July 24th, 2013. State aid: Tax exemptions; Co-financing the construction of the substation; Administrative support. Bentec GMbH is one of the leading companies which produce drilling rigs and oil and gas equipment In 2006 a subsidiary production unit of the German company was opened - “Bentec GmbH Drilling & Oilfield Systems” with the purpose of
State aid: Tax exemptions; Subsidizing part of the costs; Administrative support.
billion
billion
UMMC Bentec Drilling and Olifield Systems
billion
Tyumen Plywood plant
billion
KNAUF Insulation Tyumen» is one of the world leaders in production of thermal insulation. Today, the international group of Knauf is one of the largest manufacturers of building materials in the world. KNAUF was opened: August 22nd, 2014. State aid: Tax exemptions; Administrative support.
KNAUF Insulation Tyumen Baker Hughes
Production of oil submersible cable in Tyumen. Baker Hughes was opened: January 22nd, 2014. State aid: Tax exemptions; Administrative support.
Tyumen Plywood plan
5 types and 11 grades of plywood. 90 thousand m3 of plywood per year. 84% of productions are exported in 30 countries. The 1st stage was opened on December 18th, 2009. The second stage was opened on July 30th, 2013 The third stage was completed in 2017 State aid: Tax exemptions; Subsidizing part of the costs; Administrative support.
Bentec Drilling and Olifield Systems
Bentec GMbH is one of the leading companies which produce drilling rigs and oil and gas equipment In 2006 a subsidiary production unit of the German company was
& Oilfield Systems” with the purpose of organizing production unit in Russia Was opened in 2013. State aid: Tax exemptions; Subsidizing part of the costs; Administrative support.
DEVELOPMENT OF THE TYUMEN INDUSTRIAL HUB
DEVELOPMENT OF THE TYUMEN INDUSTRIAL HUB
«KNAUF Insulation Tyumen» is
production of thermal insulation. Today, the international group
manufacturers of building materials in the world. KNAUF was opened: August 22nd, 2014. State aid: Tax exemptions; Administrative support. Production of oil submersible cable in Tyumen. The world's third-largest oilfield services company, Baker Hughes, expressed interest to the Tyumen region in 2006. Baker Hughes was opened: January 22nd, 2014. State aid: Tax exemptions; Administrative support.
The factory for the production of perforating systems in the Nizhnetavdinsky district. The design capacity is 24 thousand pieces of drills per year and 1.5 million units of shaped charges per year. Products of DynaEnergetics Siberia are in more than 40 countries around the world. 1st phase was opened: May 16th, 2014 2nd phase was opened: September 12th, 2016 State aid: Tax exemptions; Administrative support.
Production of decorative coverings (melamine and finish film) for the furniture industry of the company. Production volume: 35.5 min m2 per year Shattdecor was opened on June 25th, 2015. State aid: Tax exemptions; Administrative support
billion
billion
billion
billion
KNAUF Insulation Tyumen DYNAener Getics Siberia Baker Hughes Shattdecor million million DEVELOPMENT OF THE TYUMEN INDUSTRIAL HUB
MC- Bauchemie
The plant «MC-Bauchemie» produces dry mortar and concrete admixtures. Also MC opened a branch of Concrete Technology Center, where MC specialists will conduct training
characteristics of modern building materials and the most effective solution of building problems. «MC-Bauchemie» was opened: May 15th, 2015 State aid: Tax exemptions; Administrative support
«Moststroy 11»
3 projects: Metal fabrication shop (8 000 tn per year) Concrete plant (38 800 m3 per year) Modernization of production capacities «Mostostroy-11» is located in Tyumen. Was opened: August 1st, 2014. State aid: Administrative support.
HMS Group
The complex storage equipment production on the basis of «Sibneftemash». The plant HMS Group produces capacitive equipment for companies: Transneft and Surgutneftegas. HMS Group was opened: October 2nd, 2013. State aid: Tax exemptions; Administrative support.
Production of decorative coverings (melamine and finish film) for the furniture industry of the company. Production volume: 35.5 min m2 per year Shattdecor was opened on June 25th, 2015. State aid: Tax exemptions; Administrative support
DEVELOPMENT OF THE TYUMEN INDUSTRIAL HUB
The plant «MC-Bauchemie» produces dry mortar and concrete admixtures. Also MC opened a branch of Concrete Technology Center, where MC specialists will conduct training on the properties and characteristics
and the most effective solution
«MC-Bauchemie» was opened: May 15th, 2015 State aid: Tax exemptions; Administrative support.
The greenhouse complex for the production of fruit and vegetables. By 2017, the complex will provide about 5.17%
from greenhouses with ultraviolet radiation and more than 15% of the consumption of vegetables from greenhouses in the Tyumen region. 1st phase was opened: January 26th, 2016. 2nd phase is planned to open in March, 2017. The investment уvolume for the 3d phase will amount to 3,5 billion rubles. State aid: Subsidizing part of the costs; Administrative support; Construction of the fish technopark in the Tyumen region. The 1st phase will be completed in March 4th, 2016. State aid: Subsidizing part of the costs; Administrative support. 3 projects:
year)
capacities «Mostostroy-11» is located in Tyumen. Was opened: August 1st, 2016. State aid: Administrative support.
million
billion
billion
billion
MC- Bauchemie «Moststroy 11» Fish Technopark «Era-98» Tyumen Agro
million
ProfModul is engaged manufacture and sale of high-quality wall and roof sandwich panels, corrugated, metal, fasade panels, drainage systems, additional elements, and
ProfModul was opened: December 20th, 2013. State aid: Subsidizing part of the costs; Administrative support «BITEX-Siberia» is the
«Skolkovo». The factory is engaged in manufacture of paints, plasters, primers BITEX brand. Capacity of the plant is 1 500 tonnes. «BITEX» was opened: May 30th, 2014. State aid: Administrative support.
million
KTS-service
million
Production of vegetable grid from polyethylene in Zavodoukovsky district. The 1st factory which produces a vegetable grids in the country. Producing until 30 Million grids per year. Was opened: May 27th, 2015. State aid: Subsidizing part of the costs; Administrative support. The factory for the production of perforating systems in the Nizhnetavdinsky district. Products of DynaEnergetics Siberia are in more than 40 countries around the world. 1st phase was opened: May 16th, 2014 2nd phase was opened: September 12th, 2016 State aid: Tax exemptions; Administrative support.
DYNA Energetics Siberia
ProfModul is engaged manufacture and sale of high-quality wall and roof sandwich panels, corrugated, metal, façade panels, drainage systems, additional elements, and
ProfModul was opened: December 20th, 2013. State aid: Subsidizing part of the costs; Administrative support The complex storage equipment production on the basis of «Sibneftemash». The plant HMS Group produces capacitive equipment for companies: Transneft and Surgutneftegas. HMS Group was opened: October 2nd, 2013. State aid: Tax exemptions; Administrative support. The project for the construction of logistics complex «Tander». Purpose: acceptance, temporary storage (5-7 days), picking of
shops and warehouses of distribution network «Magnit». Was opened: February 17th, 2016. State aid: Administrative support. The investment project for the pharmaceutical industry. «Pharmasyntez» is the largest Russian pharmaceutical company which is specializing in the production of medical drugs for the treatment of severe chronic diseases, f.e.: tuberculosis, HIV / AIDS, cancer and hematological disorders. State aid: Administrative support; Subsidizing part of the costs.
billion
billion
million
million
Phamsynthethez Tyumen
HMS Group
Logistics Comples «Tander»
ProModul DEVELOPMENT OF THE TYUMEN INDUSTRIAL HUB
Ochakovo is one of the biggest alimentary companies in Siberia. Wide range of beverages – approximately 10 types of beer and 4 sorts of “kvas”. Produces 120 mln. liters of bear and 45 mln. liters of “kvas” per year. State aid: Tax exemptions; Administrative support
million
Building of the bakery took place in small village Antipino. Baking of bread and bakery products, confectionery products. «FATUM» was opened: August 27th, 2013. State aid: Subsidizing part of the costs; Administrative support.
million million
Sladkovsky Commodity Fish farm
The closed cycle complex for fish farming, fish processing and sale of finished products. 2 fish factories are located in Sladkovsky district. Opening: October 17th, 2013. State aid: Subsidizing part of the costs; Administrative support.
Ishim brewery
Was opened: August 7th, 2014. State aid: Administrative support.
The development of the Uvat industrial hub. «Ensuring the development of the oil- production complex in the Tyumen region through involvement in the development of low-profit and high-risk stocks». Implementation period: 2004-2020 years. 22 fields in 12 license areas. Annual production: 7.5 million tons of oil per year. Planned production volumes: up to 10 million tons of oil per year, starting from 2016. State aid: Tax exemptions. Investment project for the development of new hydrocarbon crude deposits in Tyumen region. State aid: Administrative support.
DEVELOPMENT OF THE UVAT INDUSTRIAL HUB
billion
billion
million
The company «Danone» is developing the milk processing production in the Tyumen region. «Danone» is a global company, listed as
Fortune 500 list. It is one of the most successful healthy food companies in the
Unimilk» group, produces 65,000 tons of products per year. 1st phase was opened: February 6th, 2015 2nd phase was opened: March 2nd, 2016. State aid: Tax exemptions; Subsidizing part of the costs; Administrative support
Construction of the fish technopark in the Tyumen region. The 1st phase will be completed in March 4th, 2016. State aid: Subsidizing part of the costs; Administrative support
Fish Technopark «Era-98»
The greenhouse complex for the production
By 2017, the complex will provide about 5.17% of the total consumption of vegetables from greenhouses with ultraviolet radiation and more than 15% of the consumption of vegetables from greenhouses in the Tyumen region. 1st phase was opened: January 26th, 2016. 2nd phase is planned to open in March, 2017. The investment уvolume for the 3d phase will amount to 3,5 billion rubles. State aid: Subsidizing part of the costs; Administrative support;
«Zolotye luga»
Construction of a factory for the production of dairy products. Was opened 5th November, 2013 State aid: Administrative support
7 млрд.
The factory was constructed for the deep processing of wheat to the amino acid lysine 98,5%. 1st phase was opened: November 27th, 2014. 2nd phase was opened: August 27th, 2016. The project will be completed in July 2017. State aid: Subsidizing part of the costs; Administrative support. The company «Danone» is developing the milk processing production in the Tyumen region. «Danone» is a global company, listed as one of the largest companies in the Fortune 500 list. It is
companies in the world. The dairy plant «Yalutorovsk», just one of the companies in the «Danone-Unimilk» group, produces 65,000 tons of products per year. 1st phase was opened: February 6th, 2015 2nd phase was opened: March 2nd, 2016. State aid: Tax exemptions; Subsidizing part of the costs; Administrative support
OPENING OF MAJOR PRODUCTIONS (2013-2016)
billion
billion
Agroholding «Yubileyny»
million million
International Hotel Mercure is a group of companies Accor. The hotel has 192 rooms, a large conference hall, restaurant La Taiga,lobby bar The Logovo, hotel Privilege Lounge, fitness centre and parking place. Was opened: April 16th, 2015. State aid: Administrative support. International Hotel «Mercure»
In May 2016 completed an investment project on reconstruction and rebranding
brand of hotel Double Tree By Hilton. State aid: Administrative support.
Hotel Double Tree By Hilton
Balneological sanatorium «Svetly» is located within the city Yalutorovsk that 75 km. from Tyumen, on the shore of lake Babanovskoe. 100 beds. Was opened: May 27th, 2015. State aid: Investment loans; Administrative support.
Sanatorium «Svetly»
Sanatorium structure has: Medical building; Front desk; Club dining room; 5 dormitory blocks. 350 beds. Was opened: May 27th, 2015. State aid: Administrative support Sanatorium «Ingala»
IMPLEMENTATION OF DEVELOPMENT PROJECTS (2013-2016)
Shopping center «Kristal»
Was opened: December 20th, 2013. Was opened: December 1st, 2013. Was opened: October 10th, 2013.
Shopping center «Zhemchuzhyna Sibiri»
Was opened: October 27th, 2013.
Supermarket «Magnit» Universal market «Kukuruza»
Was opened: February 20th, 2013. Was opened: December 1st, 2013.
4,2
Billion Shopping center «Voyage»
Multifunctional complex «Magellan»
IMPLEMENTATION OF DEVELOPMENT PROJECTS (2013-2016)
Hypermarket «Absolut» Office and shopping center «Pyotr Stolypin» 2nd hypermarket «Lenta» 3rd hypermarket «Lenta»
Was opened: December 6th, 2013. Was opened: November 7th, 2014. Was opened: March 31th, 2014. Was opened: December 24th, 2014.
Million Billion Million Million
million
FATUM OPENING OF MAJOR PRODUCTIONS (2013-2016)
The closed cycle complex for fish farming, fish processing and sale
2 fish factories are located in Sladkovsky district. Opening: October 17th, 2013. State aid: Subsidizing part of the costs; Administrative support. «BITEX-Siberia» is the official resident of «Skolkovo». The factory is engaged in manufacture of paints, plasters, primers BITEX brand. Capacity of the plant is 1 500 tonnes. «BITEX» was opened: May 30th, 2014. State aid: Administrative support. Building of the bakery took place in small village Antipino. Baking of bread and bakery products, confectionery products. «FATUM» was opened: August 27th, 2013. State aid: Subsidizing part of the costs; Administrative support.
million
million
Sladkovsky Commodity Fish farm BITEX
«Tander» «Ostrov»
Project for the construction
distribution center of JSC «Tander». Was opened on February 17th, 2016. State aid: Administrative support.
Construction of a shopping center on the street. Fedyuninsky Was opened on March 21st, 2015. State aid: administrative support.
OPENING OF MAJOR PRODUCTIONS (2013-2016)
Production of pallets and small-sized plywood 30 thousand m3 per year Opening: August 30th, 2013. State aid: Providing investment loans; Subsidizing part of the costs; Administrative support. Production of vegetable grid from polyethylene in Zavodoukovsky district. The 1st factory which produces a vegetable grids in the country. Producing until 30 Million grids per year. Was opened: May 27th, 2015. State aid: Subsidizing part of the costs; Administrative support. Was opened: August 7th, 2014.
State aid: Administrative support.
120,4
million
Zargos 89,7
million
100
million
KTS-service Ishim brewery
Hypermarket «Okey» Was opened on September 8, 2016 State aid : Administrative support .
«Dorinda»
«City Mall»
The project for the construction of a shopping and entertainment center with an area of 81,000 square
Was opened December 7, 2016. State aid: Administrative support.
International Hotel Mercure is a group
The hotel has 192 rooms, a large conference hall, restaurant La Taiga,lobby bar The Logovo, hotel Privilege Lounge, fitness centre and parking place. Was opened: April 16th, 2015. State aid: Administrative support. Hypermarket «O'KEY» in Tymen (JSC «Dorinda») Was opened: September 8th, 2016. State aid: Administrative support. Shopping center «Ostrov» in Tyumen by the format and location of the center is classified as targeted purchases center and is designed for residents of actively developing a new microdistrict. Was opened: March 21th, 2015. State aid: Administrative support.
1,6
Billion
1,6
Billion
1
billion
International Hotel «Mercure» Hypermarket «O’KEY» Shopping Center «Ostrov»
million
Production of polymer pipes and fittings for gas and water supply. State aid: Administrative support. Was opened on April 6 in 2017.
«SibGazApp arat»
Production of expansion seams and special equipment's for bridges/
Opened on 24 May 2017. State aid: Administrative support.
«SKM-100» New workshop for the production of vegetable mesh The mesh is made from recycled plastic and polyethylene. Opened on 7 June 2017 . State aid: Administrative support. Investment loan
«MOSTOSTROY 11»
Modernization of poultry farm In the connection with the implementation of the 1st stage, they increased by 30 % the volume
quality of products The first stage was opened on June 12, 2017. State aid: Administrative support.
«PYSHMINSKY » POULTRY FARM
2,5
млрд.
Balneological sanatorium «Svetly» is located within the city Yalutorovsk that 75 km. from Tyumen, on the shore of lake Babanovskoe. 100 beds. Was opened: May 27th, 2015. State aid: Investment loans; Administrative support. In May 2016 completed an investment project on reconstruction and rebranding of the hotel «Tyumen“, a new brand
State aid: Administrative support. The project for the building of the shopping center has an area of 81 thousand sq.m. Was opened: December 7th, 2016. State aid: Administrative support.
Sanatorium structure has: Medical building; Front desk; Club dining room; 5 dormitory blocks. 350 beds. Was opened: May 27th, 2015. State aid: Administrative support
million
million
billion
billion
«BAKER HUGHES»
The total investment in the Tyumen region (including the first draft) – 2 bln. rub. Number of workplaces – 160. Opened on 20 June 2017. State aid: Administrative support. Subsidizing part of the costs;
Tax exemptions
LOGISTIC COMPLEX «KATREN», JSC TO SERVICE PHARMACIES State aid: Administrative support. Opened on 12 July 2017
«KATREN»
«ZAVOD BKY»
Modernization of «ZAVOD BKY» The upgrade was completed 23 August 2017. State aid: Administrative support Subsidizing part of the costs;
«Lenta»
Fifth hypermarket «Lenta» Was opened on September 15, 2017 State aid: Administrative support
The new logistics center of the company on the site dsk-500. State aid: Administrative support Was opened 26 September in 2017. OOO «TyumenLogo
The complex for growing turkeys in YURGINSKY district and the processing
ZAVODOUKOVSK. State aid: Administrative support Providing of a land plot for lease without bidding Opened on 11 October 2017. «Absolut- agro» JSC "Siberian Agrarian Group" Opened on 3 October 2017.
Pig breeding complex «TYUMENSKY» State aid: Administrative support.
OOO «TYUMENREMDOR MASH»
The new shop is the longitudinal cutting of metal OOO «TYUMENREMDORMASH» State aid: Administrative support Subsidizing part of the costs;
«Tyumen- nedropolzavani e» The production on extraction and processing of sapropel in YALUTOROVSK AREA Was opened on 15 October 2017. State aid: Administrative support. THERE IS A NEW FURNITURE FACTORY IN ISHIM State aid: Administrative support Investment loan Was opened on 1 December 2017 Furniture factory of Kutyrev A.S. THE PLANT FOR DEEP PROCESSING OF WHEAT IN THE AMINO ACID – LYSINE IN ISHIM AREA State aid: Administrative support Subsidizing part of the costs; « The factory of processing of wheat Yubileynyy» Processing capacity - 120 thousand tons of wheat per year. Opened on 1 December2017.
«DAMATE»
DAIRY - COMMODITY COMPLEX «DAMATE» in Golyshmanovsky district After an exit to full capacity will be the largest in the region and will produce 44.7 thousand tons of milk per year. Opened on 7 December 2017. State aid: Administrative support
THE SECOND HYPERMARKET «LEROY MERLIN» State aid: Administrative support. Was opened 22 December 2017.
«LEROY MERLIN»
A NEW PLANT FOR THE PRODUCTION OF BIG- BAGS MADE OF POLYPROPYLENE IN ISETSKY DISTRICT State aid: Administrative support Investment loan Subsidizing part of the costs; «Neo-Kom» «Kurazh» The extension of the complex for the production of confectionery products in Yalutorovsk State aid: Administrative support Investment loan
The volume of investments is 2.3 billion rubles, jobs - 580 are saved and 30 new ones are created. As a result of the implementation of the 1st stage of the program, the poultry farm increased production by 30%, increased the quality of its products. The first stage was opened on June 12, 2017.
3RD PHASE ANTIPINSK Y OIL REFINERY
Will be open in 2018. Implementation period 2010-2018 West-Siberian complex for deep processing of hydrocarbon raw materials (HCS) into polyolefin with a capacity of 2 million tons per year with a share of total facilities Implementation period: 2015-2025
West-Siberian petrochemical plant
Creation and specialization
equipment for maintenance
magistral oil pipeline facilities. Implementation period: 2017-2025
PLANT FOR THE PRODUCTION OF HORMONAL PREPARATIONS «PHARMASYNTEZ- TYUMEN», LLC Implementation period – 2015 – 2020 «PHARMASY NTEZ- TYUMEN», LLC
«TYUMEN CHEMICAL- PHARMACEUTI CAL PLANT», JSC The company plans to begin construction of a production building area of 1224 sq. m. in accordance with the requirements
million tablets a year, 40 million caps., 8 million sachets. Also it plans to start the construction of the building area of 1300 sq. m. in 2017-2020 years for production of solid and liquid dosage forms in accordance with the requirements
million tablets, 12 million bottles a year. Implementation period: 2015-2020
Expansion of the current business for the production of medical products of a single use. Implementation period: 2017-2022
THE PROJECT FOR POTATO PROCESSING «AGROFIRMA KRIMM», LLC
«AGROFIRMA KRIMM», LLC The project envisages construction of a plant for the production of: potatoes "Fresh Cut" in atmospheric packaging; peeled potato in vacuum packaging; potato, pasteurized vacuum-Packed; Capacity - 2.5 tons of finished products per hour Implementation period: 2017-2019 3RD PHASE OF THE GREENHOUSE COMPLEX «TC TYUMEN AGRO», LLC
«TC TYUMEN AGRO», LLC
Planned construction of a greenhouse complex with an area of 16 hectares for fruit and vegetable production in greenhouses, the Production capacity is 13 thousand tons per year (cucumbers, tomatoes, lettuce, eggplant, peppers) Implementation period: 2018-2020
THE NEW CATTLE- BREEDING COMPLEX «PETELINO», LLC IN YALUTOROVSK AREA Implementation period: 2017-2019 «PETELINO»
THE DAIRY COMPLEX «ECO - NIVA APK HOLDING», LLC
ECO - NIVA APK HOLDING
Since 2011, the construction
total population of 1,800 head of dairy cows. All
technology of loose housing. In parallel with dairy farming, LLC "Agrofirma "Mesopotamia" develops beef
RECONSTRUCTION OF POULTRY FARM «PYSHMINSKY» «PYSHMINSKY» It is planned to reconstruct areas of industrial flocks of laying hens. The aim of the modernization is the replacement of all equipment at the majestic, which will double the number of poultry and produce up to 400 million eggs per year. Implementation period: 2015-2020 MODERNIZATION «PTITSEFABRICA BOROVSKAYA», JSC The project envisages reconstruction and modernization
Implementation period: 2017-2020 «PTITSEFABRICA BOROVSKAYA», JSC MODERNIZATION OF «TYUMEN BROILER», JSC Implementation period 2018-2022 «TYUMEN BROILER», JSC
«Slada»
Construction of a confectionery factory on the territory of the Ishim machine-building plant. the first phase will be completed in 2018 implementation period 2017- 2022
Complex for wood processing in the village of Mugen of the Uvat district Implementation period: 2017-2018
Complex for wood processing in the village of Mugen
Creation of a modern timber industry enterprise with a full cycle of processing in the Isetsk district of the Tyumen region with an annual volume
centimeters
processing of wood waste products in pellets with a volume of 36,000 tons per year. Implementation period: 2016-2019
«Techno model»
Production of wooden pallets in Tobolsk with a capacity of 800,000 tons per year. Implementation period: 2018-2020 «Tatlesstroy»
«MULTIFUNCION ALNY COMPLEX AKVAMOLL», LLC The first stage of complex was
Implementation period - 2015 – 2020 MULTIFUNCI ONALNY COMPLEX AKVAMOLL», LLC MULTIFUNCTIONAL HOSPITAL «MAT I DITYA TYUMEN», LLC Construction of a multipurpose hospital is in the process. Its area is 15 thousand square meters. The main activities is to provide high quality medical services in the field of
IVF and Pediatrics. Implementation period - 2017 – 2019
MEDICAL CENTER «YUNIMED», LLC Implementation period - 2017 – 2022 THE HOTEL COMPLEX «Sibstroyservice», JSC
Implementation period - 2014 – 2022
The construction
multifunction al sports center and a diving center was started
Specialized hotel for athletes Implementation period - 2011 – 2018
«Tyumen Sport»
«Lukoil uralnefteprodukt»
Construction of a chain of gas stations on the territory of Tyumen and the Tyumen region Implementation period: 2018-2019 «New petrol Tyumen»
Construction of a chain
stations in the territory
Tyumen region. Implementation period: 2017-2022
«Tyumen Ecological Association»
«Sibstroyservice» Investment project for the utilization of solid domestic waste in the Tyumen region. Implementation period: 2014-2019 Construction of a plant for the production of reinforced concrete products in the Tyumen region. Implementation period: 2017-2018
Construction of a regional complex for the processing of wild berries
Implementation period: 2016-2021 «Yagody plyus» is Resident of the industrial park Borovsky
«Landis» is Resident of the industrial park Borovsky
Сonstruction of an ice cream plant The first stage of complex was
Implementation period: 2014-2018
«Siburmash» is Resident of the industrial park Borovsky
Construction of a plant for the production of oil and gas equipment. Implementation period: 2016-2018
Processing of polypropylene production of plastic packaging Implementation period: 2015-2019
«NG Group» Is Resident
industrial park Borovsky
«Tyumen Pribor» is Resident of the industrial park Borovsky «Provans group» is Resident of the industrial park Borovsky «Rost Grib» is Resident of the industrial park Borovsky
«Energotehservis» is Resident of the industrial park Borovsky
Construction of a manufacturing base for manufacturing cabinets for special equipment and weighing systems Implementation period: 2016-2018
Construction of a complex for growing champignons Implementation period: 2017-2019
Processing of leaf salads and vegetables Implementation period: 2017-2019
Construction of a technical center with an area of 10,000 square meters. the center includes assembly of modular equipment for distributed energy servicing and repair
center for training servicemen engineers. Implementation period: 2017-2019
«TyumenEnergo stroy» is Resident of the industrial park Borovsky
Construction of a confectionery factory. The project plans to produce baked goods, flakes. Implementation period: 2017-2020 «Magia vkusa» is Resident of the industrial park Borovsky
Construction of a food factory Implementation period: 2018-2020
«Alfa kinetika» is Resident of the industrial park Bogandinsky
The organization of manufacture of armatures Implementation period: 2017-2021 It is planned the construction of an industrial-logistics complex for provision
industrial processing
Implementation period: 2018-2020
«COTTON WAY» – IS THE RESIDENT OF THE INDUSTRIAL PARK BOGANDINSKIY
MORE DETAILS CAN BE FOUND ON THE WEBSITE
www.tyumen-region.ru
It offered more than 200 sites in the municipal units of the Tyumen region for the implementation of these investment projects. It offered to consider the sites in the industrial parks in Bobrowski and Bogandinsky villages for implementation of the projects. More details can be found on the website of municipal units of the Tyumen region: http://admtyumen.ru/ogv_ru/gov/local_gov/municipalities.htm On the business portal of the Government of the Tyumen region: http:/tyumen- region.ru/investments/investto/ You can contact the staff of the Department of Investment Policy and State Support Entrepreneurship of the Tyumen region and Investment Agency of the Tyumen region.