
SLIDE 1
What is a Meaningful Life?
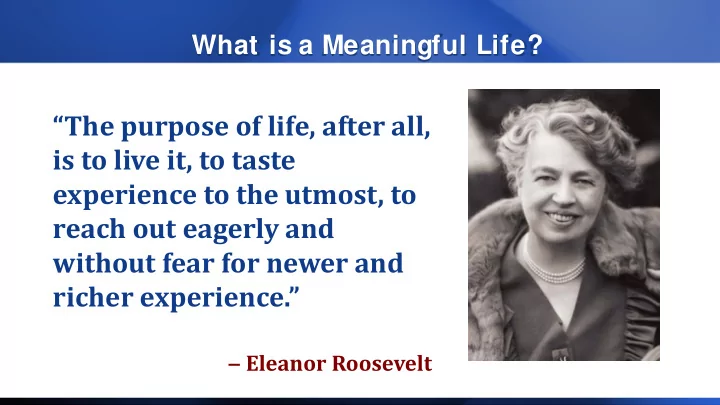
“The purpose of life, after all, is to live it, to taste experience to the utmost, to reach out eagerly and without fear for newer and richer experience.”
‒ Eleanor Roosevelt
The purpose of life, after all, is to live it, to taste experience - - PowerPoint PPT Presentation
What is a Meaningful Life? The purpose of life, after all, is to live it, to taste experience to the utmost, to reach out eagerly and without fear for newer and richer experience. Eleanor Roosevelt What is a Meaningful Life?
‒ Eleanor Roosevelt
‒ Fyodor Dostoevsky
Human Capital Social Capital Real Assets
Productivity:
reporting standards
equipment
Financial Technology
Innovative processes & components including:
securities
(mortgages, credit cards, etc.)
U.S. and Fortune 500 Employment
60 80 100 120 140 160 180 1970 1975 1980 1985 1990 1995 2000
Modern capital markets begin New financial technologies are fully implemented U.S. = + 62 million jobs Fortune 500 = minus 4 million
Source: Bureau of Labor Statistics, Bloomberg, Thomson Reuters.
Source: Small Business Administration (Statistics of U.S. Businesses/2015); U.S. Census; US Bureau of Labor Statistics
“To most of you, capital means a bank account, stock certificates or factories. “I’m talking about a different kind of
course, expenditures on medical care and lectures on the virtues of punctuality and honesty are capital too.”
Gary Becker, 1992 Nobel Prize in Economics
Black migration to the north Chinese railroad workers European immigrants Mexican “braceros” Vietnamese shrimpers Today
Asia 5% Latin America 9% Canada 10% Europe 75% Other 1%
Sources: Migration Policy Institute, U.S. Census, United Nations Population Division, 2015 Note: 2015 figures sum to 101% due to rounding.
Asia 28% Latin America 54% Canada 2% Europe 12% Other 5%
Source: U.S. Department of Homeland Security (WSJ 2/22/12 “Plan B for China’s Wealthy: Moving to the U.S./Europe)
Sources: Bret Stephens, New York Times, Four Questions About American Greatness, Dec. 7, 2017
children of immigrants.
children of immigrants.
1970.
Sources: Partnership for a New American Economy
patents
microbiology.
31 72 1900 2018
James Carey: Longevity; United Nations Development Program
invasive diseases
Source: Discovery Fit & Health
assessing the same slide will agree
survival times better than the standard practice of pathologists.
Source: Stanford University School of Medicine
Percentage of Epilepsy MFF Grant Researchers Still Active
Young Investigator Awards
100%
Mid-Level Career Awards
75%
Late-Stage Career Awards
7%
Source: Philanthropy Advisory Service, Milken Institute
10 FDA-approved treatments for prostate cancer since 2010.
Return
Job Training Preschool Programs School
Source: James Heckman, University of Chicago
Age
James Heckman
Nobel Prize in Economics
Source: New York Times – July 29, 2008
Source: IMF Outlook (9/28/17).
Per Capita GDP
1960
Singapore Jamaica
2017
Sources: City-Data.com / Global Report Card (Jay Greene and Josh McGee)
rank “proficient”
students
Beverly Hills High School
Singapore 34th percentile in math Canada 46th percentile in math
Program at Berkeley, Columbia, USC and Wharton designed to create productive partnerships within their communities.
Source: Economist, European Commission
20 40 60 80 India China WORLD Russia United States Poland Spain Sweden Italy Germany Japan 2050 2010
Number of people 65 and
percentage of the labor force
WORLDWIDE OVER THE AGE OF 60 NEXT YEAR AND MORE THAN 2 BILLION BY 2050
Source: The United Nations.
GLOBAL PORTION OF THE POPULATION 60+
Sources: UNDESA Population Division, HelpAge.
3.1 4.9 9 16.6 25.5 35 43.1 56 79.7 92
10 20 30 40 50 60 70 80 90 100 1900 1920 1940 1960 1980 2000 2012 2020 2040 2060
U.S. POPULATION 65+ (IN MILLIONS)
Sources: United States Census Bureau, United States Department of Health and Human Services.
Source: Bank of America Merrill Lynch
Source: AARP.
Source: The Scan Foundation.
WILL NEED LONG-TERM CARE
Source: Jeremy Carl, Hoover Institution, May 2018
Lowest fertility rates:
Highest fertility rates:
Source: World Bank data posted by Bloomberg, March 16, 2018
Children per woman
United Kingdom 95 years (1815-1910) United States 82 years (1844-1926) Bangladesh 20 years (1982-2002) China 11 years (1967-1978) Iran 10 years (1986-1996)
Sources: Ourworldindata.org; World Bank
1.84 1.76 2.14 1.57 1.68
Births/woman 2016
Replacement rate is 2.1 per woman.
Source: Jeremy Carl, Hoover Institution, May 2018
Belgium France Germany Italy Luxembourg Netherlands United Kingdom European Union
Source: Jeremy Carl, Hoover Institution, May 2018
Belgium
Charles Michel, 2 kids!
France
Emmanuel Macron, No kids
Germany
Angela Merkel, No kids
Italy
Paolo Gentiloni, No kids
Luxembourg
Xavier Bettel, No kids
Netherlands
Mark Rutte, No kids
United Kingdom European Union
Theresa May, No kids Jean-Claude Juncker, No kids
States with Majority “Minority” Toddler Populations
Sources: Brookings Institution (analysis of Census Bureau Population Estimates/2013); GSV
6.
Nevada 36.9%
7.
Arizona 39.1%
8.
Maryland 42.2%
9.
Florida 42.8%
43.1% Population Under Age 5 with European Ancestry
1.
Hawaii 15.2%
2.
New Mexico 24.9%
3.
California 25.1%
4.
Washington, D.C. 27.1%
5.
Texas 31.1%
Source: U.S. Census Bureau; statistica.com; migrationpolicy.org
Nationalities whose largest U.S. populations are in California (and their most-populated metro region):
Source: United Nations. Note: Latin America includes the Caribbean, dashed values are projected.
1,000 2,000 3,000 4,000 5,000 6,000 1950 1960 1970 1980 1990 2000 2010 2020 2030 2040 2050 2060 2070 2080 2090 2100 Millions
Africa Latin America Europe North America
Asia
with tools/experience to develop capital markets in their countries.
Saharan Africa and India.
leaders.
Class of 2017-2018
Source: CQS analysis; Brookings ‘The Unprecedented Promises – and Threats – of the Belt and Road Initiative as at 28 April 2017; KraneShares
people
GDP
(millions)
North America: 356 Central America: 172 South America: 416
Source: Gallup Poll, August 13, 2018
toward capitalism
toward capitalism
Source: YouGov/Victims of Communism Memorial Foundation study, Sacramento Bee, 11/4/2017
More Millennials would prefer to live in a socialist country (44%) than in a capitalist one (42%). 7% said they would prefer to live in a communist country.
socialist one.
socialist nation.
“The U.S. is the only nation where
to own the undiscovered minerals beneath their farms and woodlands. “It should thus be no surprise that … five of every six holes drilled on Earth in search of petroleum or natural gas have been drilled here.”
Portraits of the American Dream
— Buenos Aires resident
S
Source: International Monetary Fund (Washington Post 5/19/16)
“What we may be witnessing is not just the end of the Cold War … but the end of history … the end point of mankind's ideological evolution and the universalization of Western liberal democracy as the final form of human government.”
—Francis Fukuyama, 1992
Source: Freedom House 2018
Free Partly Free Not Free
1. Agriculture 2. AI / jobs 3. Distribution 4. Education 5. Energy 6. Environment 7. Finance 8. Food 9. Government 10. Health care 11. Lodging 12. Manufacturing 13. Media 14. Medical research 15. Philanthropy 16. Power transmission 17. Retail 18. Security 19. Sports 20. Transportation
Market Cap
Apple $1,013 Amazon $936 Alphabet (Google) $869 Microsoft $840 Facebook $522 Alibaba $447 Tencent $407 Netflix $147 Activision $54
Source: Thomson Reuters (8/15/18).
Market Cap Disney $168 Comcast $162 21st Fox $84 Time Warner $77 Sony $69 CBS $19 Viacom $13
Market Cap, $US Billion
Source: Thomson Reuters Datastream (8/19/2018).
$0 $10 $20 $30 $40 $50 $60 $70
2008 2009 2010 2011 2012 2013 2014 2015 2016 2017 2018
Activision EA CBS Viacom
Source: Thomson Reuters (8/13/2018). Notes: Measure based on latest EV and latest full-time employment numbers.
Macy’s $128,000 Walmart $133,000 IBM $448,000 Sony $527,000 Amazon $1.7 million Microsoft $5.9 million Alibaba $6.9 million Apple $8.6 million Google $9.6 million Facebook $19.0 million
AeroFarms in Newark, New Jersey, turns out up to two million pounds of harvest per
greens – are grown in 12 vertical layers in a 70,000 square-foot former warehouse.
60% 20% 20%
Unskilled Semi-skilled Skilled
15% 20% 65%
Unskilled Semi-skilled Skilled
1950 Today
Source: U.S. Bureau of Labor Statistics; Frey and Osborne (2013); CEA calculations
Probability of Automation by Hourly Wage
83% 31% 4% < $20/hour $20 - $40/hour > $40/hour
Source: Arntz, Gregory, and Zierahn (2016) calculations based on the PIAAC 2012.
By Education Level
44% 8% 0%
No HS degree Trade School Graduate Degree
19%
HS Degree
1%
Bachelor’s Degree
6%
AA Degree
Source: U.S. Bureau of Labor Statistics; Bloomberg Businessweek November 29 2017
Telecommunications
Department stores
Motion picture and sound recording
Food and beverage stores
Clothing stores
Sporting goods, hobby, book stores -13 Publishing industries, ex-Internet
Nursing care facilities
Apparel manufacturing
Electronic stores
United States, Year-over-Year, Thousands
Retail industry accounts for four
subsectors with the largest job losses.
$924.9B 5185%
2006 Market Cap
Sources: Thomson Reuters (8/13/2018); 2006 = Peak Market Value
Walmart $214.0B Target $51.3B Best Buy $28.4B Sears $27.8B Kohl’s $24.2B Macy’s $24.2B JCPenny $18.1B Nordstrom $12.4B TOTAL $400.4B
2018 Market Cap Gain
Walmart $264.5B 24% Target $43.7B (15%) Best Buy $21.5B (24%) Sears $0.2B (99%) Kohl’s $12.8B (47%) Macy’s $12.3B (49%) JCPenny $0.8B (96%) Nordstrom $8.9B (28%) TOTAL $358.3 Amazon $17.5B
time record $74 billion
Projects Agency
universities throughout the 1960s
Administration
Source: PC World