Texas Flood Response System Developing Near-Real-Time Flood Impact - - PowerPoint PPT Presentation

texas flood response system
SMART_READER_LITE
LIVE PREVIEW

Texas Flood Response System Developing Near-Real-Time Flood Impact - - PowerPoint PPT Presentation

Texas Flood Response System Developing Near-Real-Time Flood Impact Mapping in Texas Dr. David Arctur , University of Texas at Austin Center for Water and the Environment (CWE) Presentation to H-GAC Geographic Data Workgroup, 3 October 2018


slide-1
SLIDE 1
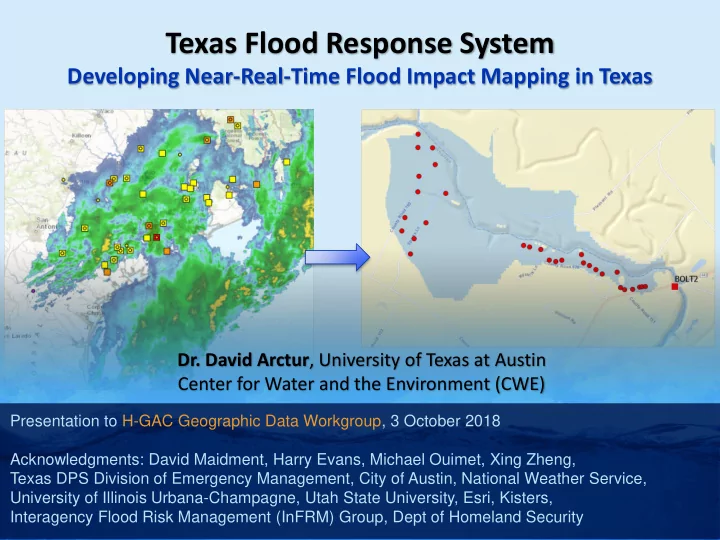
  • Dr. David Arctur, University of Texas at Austin

Center for Water and the Environment (CWE)

Presentation to H-GAC Geographic Data Workgroup, 3 October 2018 Acknowledgments: David Maidment, Harry Evans, Michael Ouimet, Xing Zheng, Texas DPS Division of Emergency Management, City of Austin, National Weather Service, University of Illinois Urbana-Champagne, Utah State University, Esri, Kisters, Interagency Flood Risk Management (InFRM) Group, Dept of Homeland Security

Texas Flood Response System

Developing Near-Real-Time Flood Impact Mapping in Texas

slide-2
SLIDE 2

Texas Flood Response System Key Topics

  • Purpose & objectives
  • Address Points
  • Height Above Nearest Drainage (HAND)
  • Estimating inundation from streamflow forecasts
  • Adapting NOAA National Water Model outputs

for use by public safety community across Texas

  • Major test: Hurricane Harvey
  • Developments needed for use at county level
  • Methodology and next steps with HAND
slide-3
SLIDE 3

Texas Flood Response System

The QUESTION: How do you go from a radar rain map to a flood inundation map showing impacts? Keeping in mind… “we’re predicting a flood based on a prediction of rain, neither of which has happened”

  • Greg Waller, WGRFC
slide-4
SLIDE 4

Texas Flood Response Project

County Partners

  • Travis County Commissioners
  • Capital Area Fire Chief

Association

  • Travis County Emergency Management
  • Blanco County Emergency Management
  • Williamson County Emergency Management
  • Wharton County Emergency Management
  • Williamson County Fire Chiefs
  • Upper Brushy Creek Water Control District
  • San Marcos Emergency Management
  • Hays County Emergency Management

State Partners

  • Texas Division of Emergency

Management (TDEM)

  • Texas Natural Resource

Information Systems (TNRIS)

  • Texas Water Development

Board (TWDB)

  • Texas Commission on

Environmental Quality (TCEQ)

  • Texas Department of

Transportation (TxDOT)

  • Texas Floodplain Managers

City Partners

  • City of Austin
  • Austin Fire Department
  • Austin Flood Early Warning

System (FEWS)

  • Austin Homeland Security

Emergency Management (HSEM)

  • Houston Office of Emergency

Management

Federal Partners

  • National Weather Service (NWS)
  • National Oceanic Atmospheric

Administration (NOAA)

  • Federal Emergency Management

Agency (FEMA)

  • US Geological Survey (USGS)
  • US Army Corps of Engineers (USACE)
slide-5
SLIDE 5

Proposed Approach

Strategic Flood Response Base Map

Assessment

  • f Conditions

Emergency Response Discussion

Real-Time Inundation Map Flood Impact Assessment System Three key elements: Strategic Flood Base Map Real-Time Inundation Map Flood Impact Assessment System

Texas Flood Response System

slide-6
SLIDE 6

Key ingredient: Address Points…

Used for dispatching emergency response equipment in 9-1-1 systems

slide-7
SLIDE 7

Texas 9-1-1 Alliance

Texas Emergency GIS Response Team (EGRT)

CSEC

So where are the address points?

slide-8
SLIDE 8

Texas Address Points as of Aug 2017

What we collected…

Who helped us:

CSEC/Geo-Comm: 213 counties, ~3 million addresses Texas 9-1-1 Alliance & EGRT: 41 counties, ~6.2 million addresses Totals: 254 counties, ~9.2 million addresses

slide-9
SLIDE 9

Simpler schema, with county, COG, district & region ID’s for easy aggregation

Then merged…

Created one feature class for flood risk study and planning

Who helped us:

CSEC/Geo-Comm: 213 counties, ~3 million addresses Texas 9-1-1 Alliance & EGRT: 41 counties, ~6.2 million addresses Totals: 254 counties, ~9.2 million addresses

slide-10
SLIDE 10

Next: A method for estimating flood risk… Height Above Nearest Drainage (HAND)

Flooding occurs when Water Depth is greater than HAND

HAND Flood Normal

Address Point

slide-11
SLIDE 11

Height Above Nearest Drainage for Texas

Computed on Univ of Illinois CyberGIS supercomputer from 10m National Elevation Dataset: CONUS HAND computed in ~ 1 day

Method can be performed on moderate basins with desktop GIS

slide-12
SLIDE 12

Simple raster operation

Last step: add HAND elevation to address points…

Further development and testing is in progress to refine HAND values along coast and wherever else needed

slide-13
SLIDE 13

HAND value assigned to each address point Useful for planning responses and mitigations…

slide-14
SLIDE 14

Detailed engineering modeling on creeks Austin, Texas: A data rich community

slide-15
SLIDE 15

The Goal: Identify potentially impacted structures for a given flood event in advance if possible,

  • r in near-real time
slide-16
SLIDE 16

Operational since August 2016

slide-17
SLIDE 17

National Water Model

http://water.noaa.gov/map

Streamflow – Analysis with Assimilation

slide-18
SLIDE 18

National Water Model

http://water.noaa.gov/map

Streamflow – Anomaly based on ~30 yr history

slide-19
SLIDE 19

National Water Model

http://water.noaa.gov/map

Stream reach selected (Trinity R. at Cleveland)

slide-20
SLIDE 20

National Water Model

http://water.noaa.gov/map

Forecast charts (Trinity R. at Cleveland)

slide-21
SLIDE 21

Forecasts

Now Analysis Best estimate of current conditions Short Range Hourly for 18 hours ahead, updated hourly Medium Range 3 Hourly for 10 days ahead, updated 6-hourly Long Range Daily for 30 days ahead Ensemble of 4 forecasts each 6 hours (24 forecasts total) ftp://ftpprd.ncep.noaa.gov/pub/data/nccf/com/nwm/prod/

Version 1.1 operational on 5 May 2017

slide-22
SLIDE 22

Automated workflow for translating NWS forecasts into TDEM impact Two Commercial Firms: Esri and Kisters

Assessment of impact Convert depth to flood inundation National Water Model discharge forecasts Conversion of discharge to depth

NWS TDEM

slide-23
SLIDE 23

National Water Model Viewer

https://nwm.kisters.de/applications/index.html?publicuser=publicuser#NWM/main

slide-24
SLIDE 24

Then Hurricane Harvey arrived August 25

72-hour precipitation forecast, 9:40am

https://arcg.is/1O1SW0

slide-25
SLIDE 25

National Water Model: August 31 Streamflow

10 day anomaly forecast on August 25…

https://arcg.is/1O1SW0

The only USGS gage flooded on Aug 25

slide-26
SLIDE 26

Day 2: TX DPS Harvey Dashboard online

With permission of TDEM

slide-27
SLIDE 27

Day 2: Maps of shelters, road closures, critical infrastructure

With permission of TDEM

slide-28
SLIDE 28

Day 3: Inundation Areas

Guadalupe River Colorado River Brazos River Harris County Trinity River Neches River

Flood Modeling Credits: Interagency Flood Risk Management (InFRM) Group With permission of TDEM

slide-29
SLIDE 29

Day 3: Inundation Impacts

Guadalupe River: 834 Colorado River: 18,577 Brazos River: 57,986 Harris County: 40,349 Trinity River: 3,354 Neches River: 863

Address Data Credits: UT Austin Center for Water and the Environment Flood Modeling Credits: Interagency Flood Risk Management (InFRM) Group With permission of TDEM

slide-30
SLIDE 30

Medium-Range Forecast on Aug 29, 2017. Flood Modeling Credits: National Water Center and UT Center for Water and the Environment.

Day 4: National Water Model 10-day forecast

With permission of TDEM

National Water Center provided experimental inundation areas during the first week of Harvey, based on NWM streamflow forecasts, synthetic rating curves, and HAND

slide-31
SLIDE 31

Day 4: Inundation, Harris County

Flood Modeling Credits: Interagency Flood Risk Management (InFRM) Group With permission of TDEM

slide-32
SLIDE 32

Day 4: Inundation demographics

With permission of TDEM Flood Modeling Credits: Interagency Flood Risk Management (InFRM) Group

slide-33
SLIDE 33

Day 7: Flood depth grids, Neches & Sabine Rivers

Flood Modeling Credits: Interagency Flood Risk Management (InFRM) Group With permission of TDEM

slide-34
SLIDE 34

Day 14: Post-event imagery, status of shelters, stores, insurance claims

With permission of TDEM

slide-35
SLIDE 35

Day 23: Final flooding impacts

Early, rough estimates for 56 state and federal disaster-declared counties: ~ 9,000 sq mi flooded ~ 40,000 river-miles ~ 966,000 addresses

Flood Modeling Credits: Interagency Flood Risk Management (InFRM) Group and UT Austin Center for Water and the Environment. Address Data Credits: US Dept of Homeland Security and UT Austin Center for Water and the Environment With permission of TDEM

slide-36
SLIDE 36

Completed Nov 2017

slide-37
SLIDE 37

Civil Air Patrol – Aerial Photos

http://cuahsi.maps.arcgis.com/apps/View/index.html?appid=24f931d10df2451581f09155bb01474f

slide-38
SLIDE 38

Texas Flood Response System: Accomplishments

  • 9.3 million Address Points collected for the entire state
  • Determined “height above nearest drainage” (HAND) for each point
  • Developed statewide synthetic rating curves for all 100K streams in

Texas (hydrology procedure to relate stream depth to flow rate)

  • Kisters gauge network linked to National Water Model
  • Esri statewide impacts map created
  • Local, engineer scale maps completed and deployed (City of Austin)
  • Extensive collaboration with NWS, University of Illinois, Utah State

University, National Science Foundation, Kisters, Esri, TDEM, TNRIS and UT Austin – Supercomputer computation

slide-39
SLIDE 39

Texas Flood Response System: Developments needed for use at county level

  • HAND from Lidar (improve resolution from 10m to 1m)
  • Improved rainfall forecasts
  • More ground-truth observations (stream gages)
  • Production-scale services for sustainable use
  • Improved collaboration between NOAA National

Water Center, Regional Forecast Centers, and local ground truth sources

slide-40
SLIDE 40

Hurricane Harvey 2017 Data Archive

https://arcg.is/1GWyKi

Thank you! David Arctur

david.arctur @ utexas.edu https://arcg.is/1GWyKi