
SLIDE 1
1
Dead Loads: Gravity loads of constant magnitudes and fixed positions that act permanently on
Structural Loads Structural Loads
p p y the structure. Such loads consist
- f the weights of the structural
system itself and of all other material and equipment perma- nently attached to the structural
- system. Weights of permanent
1
equipment, such as heating and air-conditioning systems, are usually obtained from the manufacturer.
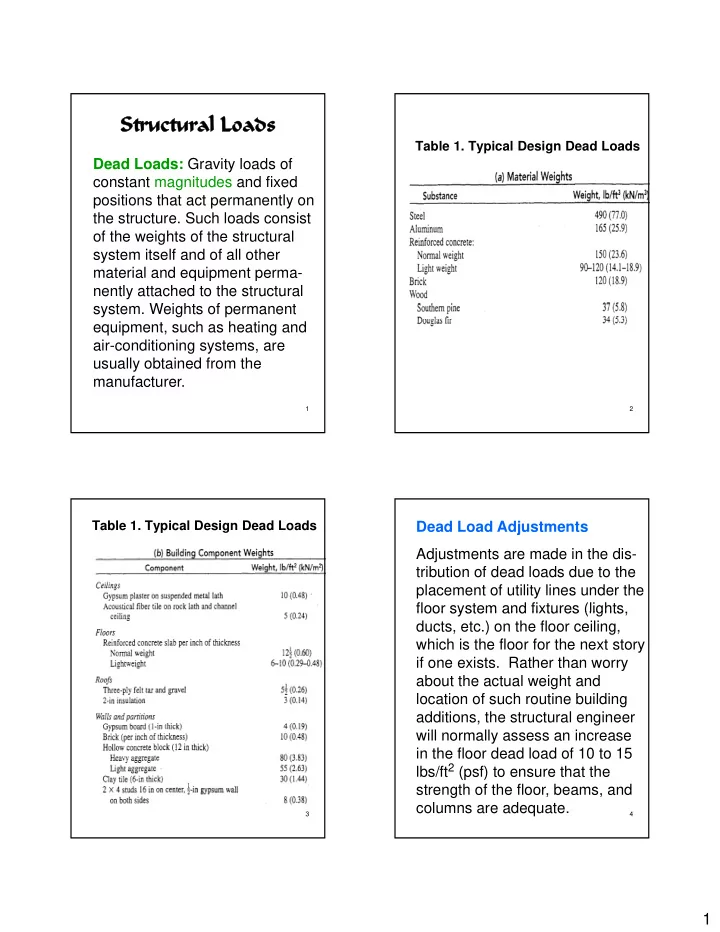
Table 1. Typical Design Dead Loads
2
Table 1. Typical Design Dead Loads
3
Dead Load Adjustments Adjustments are made in the dis- tribution of dead loads due to the placement of utility lines under the floor system and fixtures (lights floor system and fixtures (lights, ducts, etc.) on the floor ceiling, which is the floor for the next story if one exists. Rather than worry about the actual weight and location of such routine building additions, the structural engineer
4