
SLIDE 1
AIM Training Workshop, Tsukuba October 2007
South Africas Low Carbon Society Energy Snapshot Tool - - - PowerPoint PPT Presentation
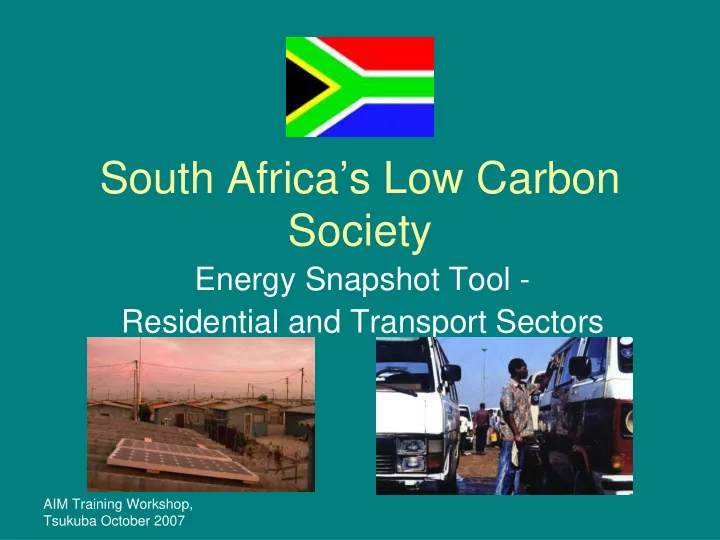
South Africas Low Carbon Society Energy Snapshot Tool - Residential and Transport Sectors AIM Training Workshop, Tsukuba October 2007 Outline of Presentation Background Narrative of scenarios for South Africa Residential
AIM Training Workshop, Tsukuba October 2007
AIM Training Workshop, Tsukuba October 2007 2
AIM Training Workshop, Tsukuba October 2007 3
AIM Training Workshop, Tsukuba October 2007 4
Deregulated High Growth (DHG) Regulated Moderate Growth (DMG)
AIM Training Workshop, Tsukuba October 2007 5
AIM Training Workshop, Tsukuba October 2007 6
growth (7%), competitive markets and urban renewal.
industry focus - sustainable industrialisation initiative to add value to primary resources. Focus
services sector.
imports
skills and business development
some renewables.
(4%). Rural upliftment and agricultural incentives.
ecotourism focus. Adding value to primary resources. Small farmers
increase exports, co-operation with neighbouring countries
funded, students encouraged to study arts and humanities
renewables and energy efficiency
AIM Training Workshop, Tsukuba October 2007 7
increase
population
more small households
increase
population
the same as present
large households
AIM Training Workshop, Tsukuba October 2007 8
AIM Training Workshop, Tsukuba October 2007 9
Interventions common to both scenarios
design for energy efficiency (passive solar, insulation, solar water heaters)
awareness campaigns
solar water heaters
for cooking and heating
appliances (particularly for biomass) DHG Specific
appliances
RMG Specific
water heaters.
biomass appliances
AIM Training Workshop, Tsukuba October 2007 10
1 2 2 3 3 4 2000 2050 DHG (CM) 2050 RMG (CM) COL OIL GAS BMS S/ W Heat H2 ELE
CO2 emission in residential sector with allocated emission from heat Energy consumption in residential sector
1 2 2 3 3 4 4 5 2000 2050 DHG (CM) 2050 RMG (CM)
COL OIL GAS BMS S/ W Heat H2 ELE
AIM Training Workshop, Tsukuba October 2007 11
Base Year 2000 Population 45.081 million Trip Generation Coefficient 1.695 trip/capita/d ay Generated trip (Year) 27890.4877 million trip Urban Population rate Unit Walk Bicycle Motorbi ke Car Bus Railway Total Modal Share % 19% 1% 1% 45% 30% 4% Trip Distance km/trip 1.00 5.00 14.33 15.73 20.00 26.63 Passenger trip passenger- km 5,373 1,269 3,303 197,468 167,343 29,708
AIM Training Workshop, Tsukuba October 2007 12
Targeted Year Settings DHG Base Year 2050 Population 45.081 million Trip Generation Coefficient 1.8 trip/capit a Generated trip 29618.217 million trip Urban Population rate Unit Walk Bicycle Motorbi ke Car Bus Railway Total Modal Share % 5% 5% 10% 30% 35% 15% Trip Distance km/trip 1.00 5.00 14.33 15.73 20.00 15.00 Passenger trip passenger- km 1481 7405 42457 139801 207328 66641
AIM Training Workshop, Tsukuba October 2007 13
Targeted Year Settings RMG Base Year 2050 Population 51.332 million Trip Generation Coefficient 1.8 trip/capit a Generated trip 33725.124 million trip Urban Population rate Unit Walk Bicycle Motorbi ke Car Bus Railway Total Modal Share % 5% 10% 15% 30% 30% 10% Trip Distance km/trip 1.00 5.00 14.33 20.00 25.00 30.00 Passenger trip passenger- km 1686 16863 72516 202351 252938 101175
AIM Training Workshop, Tsukuba October 2007 14
Energy consumption in passenger transportation sector CO2 emission in passenger transportation sector with allocated emission from heat
2 3 4 5 6 7 8 9 2000 2050 DHG (CM) 2050 RMG (CM) COL OIL GAS BMS S/W Heat H2 ELE
2 3 4 5 6 7 2000 2050 DHG (CM) 2050 RMG (CM) COL OIL GAS BMS S/ W Heat H2 ELE
AIM Training Workshop, Tsukuba October 2007 15
Energy consumption in passenger transportation sector CO2 emission in freight transportation sector with allocated emission from heat
10 15 20 25 30 35 2000 2050 DHG (CM) 2050 RMG (CM) COL OIL GAS BMS S/ W Heat H2 ELE
10 15 20 25 30 2000 2050 DHG (CM) 2050 RMG (CM) COL OIL GAS BMS S/ W Heat H2 ELE