
SLIDE 1
1 SAS SAS Q3 201 2015/2 /2016
08.09.2016
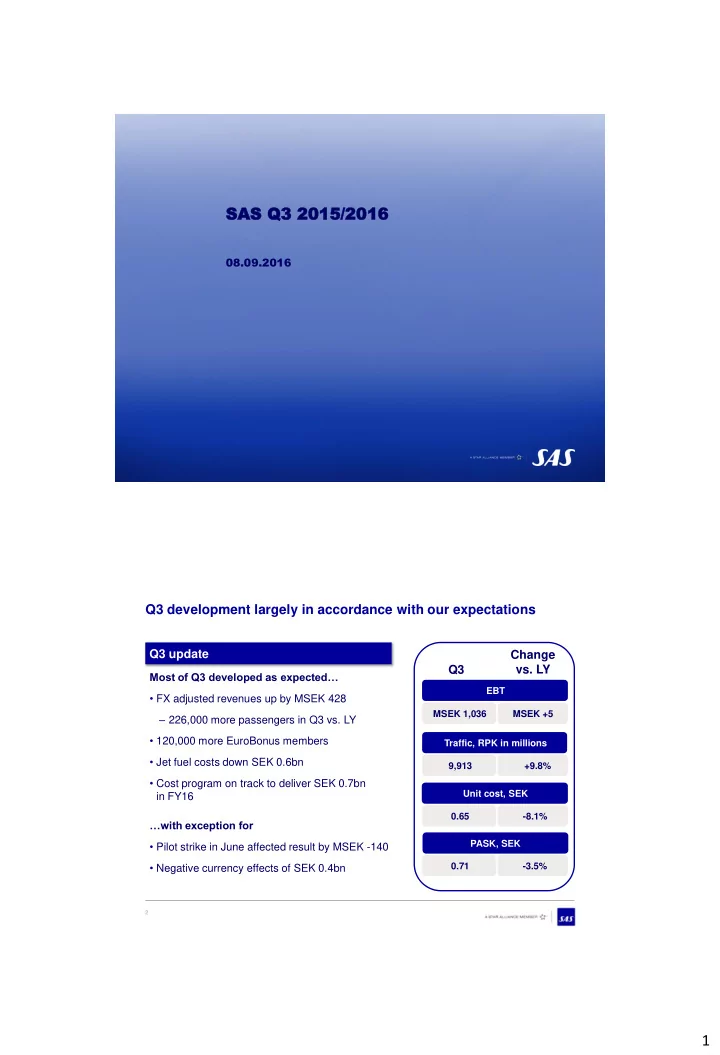
Q3 development largely in accordance with our expectations
2
MSEK 1,036 EBT 9,913 Traffic, RPK in millions 0.65 Unit cost, SEK MSEK +5 +9.8%
- 8.1%
- 3.5%
PASK, SEK 0.71
Q3 Change
- vs. LY
Q3 update
Most of Q3 developed as expected…
- FX adjusted revenues up by MSEK 428
‒ 226,000 more passengers in Q3 vs. LY
- 120,000 more EuroBonus members
- Jet fuel costs down SEK 0.6bn
- Cost program on track to deliver SEK 0.7bn
in FY16 …with exception for
- Pilot strike in June affected result by MSEK -140
- Negative currency effects of SEK 0.4bn