
SLIDE 1
6/10/2016 1
TELECONFERENCE
SAS SAS Q2 201 2015/2 /2016
10.06.2016
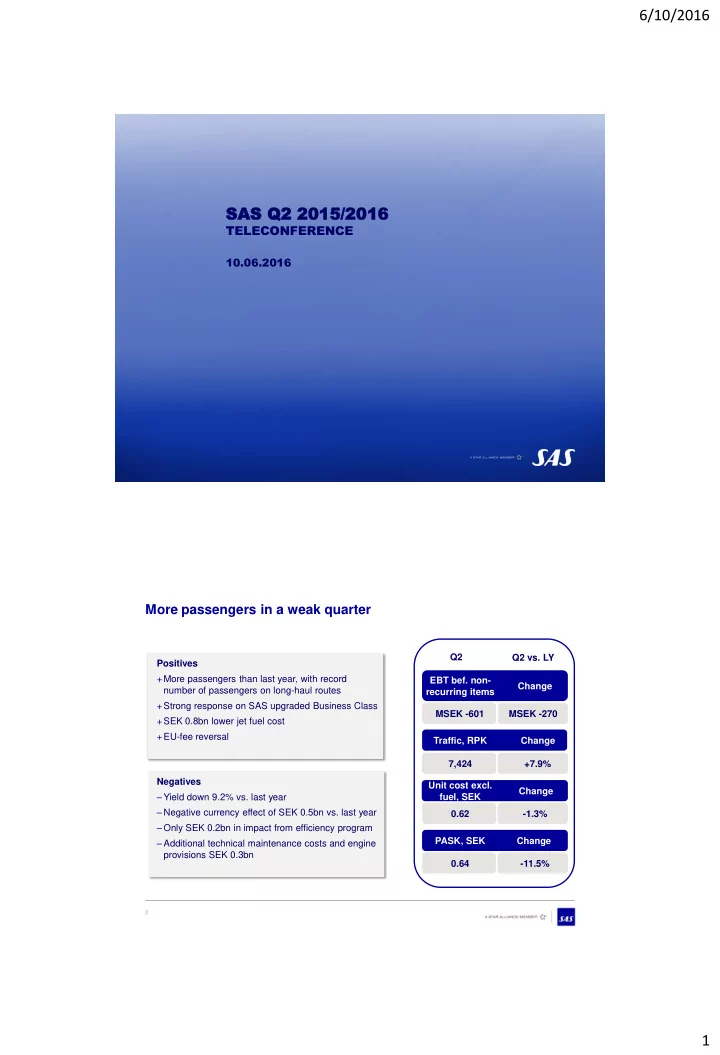
More passengers in a weak quarter
2
Negatives ‒ Yield down 9.2% vs. last year ‒ Negative currency effect of SEK 0.5bn vs. last year ‒ Only SEK 0.2bn in impact from efficiency program ‒ Additional technical maintenance costs and engine provisions SEK 0.3bn Positives +More passengers than last year, with record number of passengers on long-haul routes +Strong response on SAS upgraded Business Class +SEK 0.8bn lower jet fuel cost +EU-fee reversal MSEK -601 EBT bef. non- recurring items 7,424 Traffic, RPK 0.62 Unit cost excl. fuel, SEK MSEK -270 Change Change +7.9%
- 1.3%
- 11.5%
PASK, SEK 0.64 Change Change Q2 Q2 vs. LY