
SLIDE 1
1
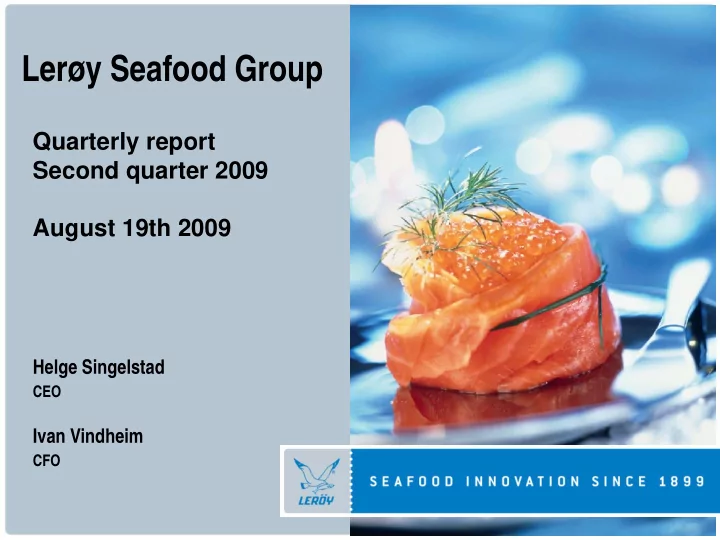
Lerøy Seafood Group
Quarterly report Second quarter 2009 August 19th 2009
Helge Singelstad
CEO
Ivan Vindheim
CFO
Lery Seafood Group Quarterly report Second quarter 2009 August - - PowerPoint PPT Presentation
Lery Seafood Group Quarterly report Second quarter 2009 August 19th 2009 Helge Singelstad CEO Ivan Vindheim CFO 1 Agenda 1 1. Considerations 2 2. Key financial figures Q2 2009 3 3. Lery at a glance 4 4. Market glance 2
1
Helge Singelstad
CEO
Ivan Vindheim
CFO
2
1. Considerations 2. Key financial figures Q2 2009 3. Lerøy at a glance 4. Market glance
2 3 4 1
3
All figures in NOK mill
Q2 - 09 Q2 - 08 Change H1 - 09 H1 - 08 Change 2008 Turnover 1 823 1 515 20 % 3 344 2 832 18 % 6 057 EBITDA 270 101 167 % 462 217 113 % 534 EBIT bef adj biom 222 52 329 % 363 120 203 % 337 PTP bef adj biom 219 19 1053 % 343 63 444 % 201
*)
*) PTP = Pre-Tax Profit
4
potential
biological issues
in Q2
5
Sales and distribution
Affiliated companies
(Norskott/Scottish Sea Farms)
NOK150m
strategic growth
6
going forward
7
1. Considerations 2. Key financial figures Q2 2009 3. Lerøy at a glance 4. Market glance
2 3 4 1
8
All figures in NOK 000
9
All figures in NOK 000
10
All figures in NOK 000
11
1) Resultatmargin = Resultat før skatt / salgsinntekter Profit margin = Profit before tax / revenues 2) Driftsmargin = Driftsresultat / salgsinntekter Operating margin = Operating profit / revenues 3) Resultat per aksje = Majoritetens andel resultat / Gjennomsnittlig antall aksjer Earnings per share = Majority interests / Average number of shares 4) ROCE = [Resultat før skatt + netto finansposter] / Gjennomsnitt [netto rentebærende gjeld + sum egenkapital] ROCE = [Profit before tax + Net financial items] / [Net interest bearing debt + Total equity] 5) Kontantstrøm fra drift Cash-flow from operations
12
NOK million 2009 2010 2011 2012 2013 Instalments 217 249 230 215 214
*) Adjusted for bank deposits and deferred tax associated with licenses
*)
13
1. Considerations 2. Key financial figures Q2 2009 3. Lerøy at a glance 4. Market glance
2 3 4 1
14
Scotland/Shetland Farming
Japan
China
North America
Spain, Portugal, France
Norway Farming
Sweden
Turkey
Chile
15
Sales & Distribution
Norskott Havbruk AS** 50% Alfarm Alarko Lerøy*** 50%
Affiliated
* Division national distribution ** Salmon farming *** Distribution, processing, smokehouse
Hallvard Lerøy AS 100% Nordvik SA 90% Lerøy Sverige AB 100% Lerøy Fossen AS 100% Lerøy West 100%
Production
Lerøy Mid-Norway 100% Portnor Lda 60% Lerøy Sjømatgruppen * Lerøy Smøgen Seafood AB 100% Sigerfjord Aqua AS 95.55% Bulandet Fiskeindustri AS 53.17% Lerøy North 100%
= Salmon farming, processing = Processing, smokehouse = Arctic char farming = Processing white fish
16
France, Portugal and Turkey
Japan, China and USA)
17
Farms in Scotland
with a global sales network
economies of scale and avoidance
18
19
EU 56,6 % Others 1,9 % USA and Canada 8,6 % Norway 16,7 % Asia Pacific 11,6 % Rest of Europe 4,5 %
20
Whole salmon 45,6 % Processed salmon 29,6 % White fish 9,3 % Pelagic fish 1,5 % Salmontrout 6,2 % Shellfish 3,5 % Others 4,3 %
21
22
**)
Company Ownership Licences
2007 2008 2009E share No individuals GWT GWT GWT Lerøy Midnor AS 100 % 30 9,5 29 200 29 100 35 000 Lerøy Aurora AS 100 % 17 5,0 17 100 17 200 20 500 Lerøy Hydrotech AS 100 % 24 7,0 20 100 23 000 22 000 Lerøy Vest AS*) 100 % 34 14,2 22 500 23 400 32 500 Total Norway 105 35,7 88 900 92 700 110 000 Norskott Havbruk AS (UK) 50 % 6,0 12 000 11 400 13 000 Total 41,7 100 900 104 100 123 000
Consolidated, farming Affiliated, farming *) Merger of Lerøy Austevoll AS and the farming activities in Lerøy Fossen AS **) LSG’s share
23
**)
Company Ownership Volume Volume Share Rest Share share 2009E YTD Q2 % 2009E % Lerøy Midnor AS 100 % 35 000 15 200 43 % 19 800 57 % Lerøy Aurora AS 100 % 20 500 8 300 40 % 12 200 60 % Lerøy Hydrotech AS 100 % 22 000 6 600 30 % 15 400 70 % Lerøy Vest AS*) 100 % 32 500 15 300 47 % 17 200 53 % Total Norway 110 000 45 400 41 % 64 600 59 % Norskott Havbruk AS (UK) 50 % 13 000 5 700 44 % 7 300 56 % Total 123 000 51 100 42 % 71 900 58 %
Consolidated, farming Affiliated, farming *) Merger of Lerøy Austevoll AS and the farming activities in Lerøy Fossen AS **) LSG’s share
24
Figures NOKm Lerøy Midnor Lerøy Hydrotech Lerøy Aurora Lerøy Vest Others / elimination Total Q2 2009 Total Q2 2008 Revenues 204,5 146,6 118,3 274,2 124,7 868,3 749,3 EBIT before biom.adj 59,4 24,6 28,9 55,6 6,6 175,0 30,3 EBIT 101,5 73,6 40,4 117,4 6,6 339,5 3,0 Volumes (gwt) 6,0 4,4 3,7 9,2 23,2 23,5 EBIT/kg 10,0 5,6 7,8 6,1 7,2 1,1
**)
*) Including VAP (post / pre-rigor, fillets, portions etc) **) Biological issues in Lerøy Vest in 2007 and 2008 causing high prod cost / RFS
*) *)
25
Figures NOKm Lerøy Midnor Lerøy Hydrotech Lerøy Aurora Lerøy Vest Others / elimination Total YTD Q2 09 Total YTD Q2 08 Revenues 475,4 215,1 250,6 435,1 211,5 1 587,8 1 296,9 EBIT before biom.adj 126,9 28,8 55,7 76,3 6,5 294,2 95,1 EBIT 131,7 94,2 60,3 140,3 6,5 433,0
Volumes (gwt) 15,2 6,6 8,3 15,3 45,4 41,5 EBIT/kg 8,3 4,4 6,7 5,0 6,3 2,2
**)
*) Including VAP (post / pre-rigor, fillets, portions etc) **) Biological issues in Lerøy Vest in 2007 and 2008 causing high prod cost / RFS
*) *)
26
Figures NOKm Sales & Distribution Elimination Total Q2 2009 Total Q2 2008 Revenues 1 942,9
1 808,9 1 484,5 EBIT before biom.adj 52,2 0,2 52,4 32,1 EBIT 52,2 0,2 52,4 32,1
27
Figures NOKm Sales & Distribution Elimination Total YTD Q2 2009 Total YTD Q2 2008 Revenues 3 577,7
3 275,7 2 761,4 EBIT before biom.adj 81,9 0,4 82,3 40,4 EBIT 81,9 0,4 82,3 40,4
28
NOKm
Q2 2009 Q2 2008 YTD 2009 YTD 2008 2008
Revenues
202 167 387 362 772
EBITDA
54 26 96 59 94
EBIT bef adj biom
42 17 75 39 58
EBIT
64 15 114 30 56
Pre tax
61 8 108 17 31
Volumes (gwt)
5,5 5,0 11,3 11,2 22,8
EBIT/kg
7,7 3,4 6,6 3,5 2,5
Balance sheet
30.06.2009 30.06.2008 31.12.2008
Licences, goodwill
409 408 386
Tangible fixed assets
228 198 226
Inventories
582 433 493
Other current assets
89 82 99
Total assets
1 309 1 121 1 205
Equity
561 513 508
Debt
748 608 696
Total equity and debt
1 309 1 121 1 205
Net interest bearing debt
463 366 421
29
1. Considerations 2. Key financial figures Q2 2009 3. Lerøy at a glance 4. Market glance
2 3 4 1
30
Fresh Atlantic Salmon Norway (4-5 kg) – Spot price development week 01-1997 – week 32-2009 (FHL/NSL/NOS)
Figures as per 12.08.09 Source: FHL/NSL/NOS 10 15 20 25 30 35 40 45 50
1997-1 1997-10 1997-19 1997-28 1997-37 1997-46 1998-3 1998-12 1998-21 1998-30 1998-39 1998-48 1999-4 1999-13 1999-22 1999-31 1999-40 1999-49 2000-6 2000-15 2000-24 2000-33 2000-42 2000-51 2001-8 2001-17 2001-26 2001-35 2001-44 2002-1 2002-10 2002-19 2002-28 2002-37 2002-46 2003-3 2003-12 2003-21 2003-30 2003-39 2003-48 2004-05 2004-14 2004-23 2004-32 2004-41 2004-50 2005-06 2005-15 2005-24 2005-33 2005-42 2005-51 2006-08 2006-17 2006-26 2006-35 2006-44 2007-1 2007-10 2007-19 2007-28 2007-37 2007-46 2008-3 2008-12 2008-21 2008-30 2008-39 2008-48 2009-5 2009-14 2009-23 2009-32
NOK/kg FCA Oslo 4-5kg
31
SPOT prices, fresh Atlantic salmon, cross-section, FCA Oslo, as of week 32-2009.
NOK / kg Oslo
Avrg Q2 09 NOK 35.10 vs avrg Q2 08 NOK 25.02 (+40.3%) Avrg H1 09 NOK 31.66 vs avrg H1 08 NOK 24.98 (H1 07 NOK 26.23) Avrg 08 NOK 25.75, avrg 07 NOK 24.97
Figures as per 12.08.09 Source: FHL/NSL/NOS 12,00 14,00 16,00 18,00 20,00 22,00 24,00 26,00 28,00 30,00 32,00 34,00 36,00 38,00 40,00 42,00 44,00 46,00 2003-1 2003-14 2003-27 2003-40 2004-1 2004-14 2004-27 2004-40 2004-53 2005-13 2005-26 2005-39 2005-52 2006-13 2006-26 2006-39 2006-52 2007-13 2007-26 2007-39 2007-52 2008-13 2008-26 2008-39 2008-52 2009-13 2009-26
Quarterly price Weekly price
32
”Others” is specified on the following slide (Volume in tons WFE, value in thousand NOK)
Figures as per 28.07.09 Source: NSEC
Volume 2008 Volume 2009 Change Value 2008 Value 2009 Change EU 250 657 265 930 6,1 % 6 086 581 7 641 163 25,5 % Others 45 583 41 521
1 041 687 1 211 239 16,3 % Japan 12 692 13 665 7,7 % 356 741 460 276 29,0 % Russia 28 666 29 835 4,1 % 655 934 767 828 17,1 % USA 5 005 15 784 215,4 % 162 506 611 881 276,5 % In total 342 603 366 735 7,0 % 8 303 449 10 692 387 28,8 %
33
(Volume in tons WFE, value in thousand NOK)
"Others" Volume 2008 Volume 2009 Change Value 2008 Value 2009 Change Ukraine 9 759 5 412
136 286 105 818
Hongkong 6 431 7 273 13,1 % 164 234 225 043 37,0 % China 4 346 4 457 2,6 % 101 588 134 049 32,0 % South Korea 2 833 2 988 5,5 % 73 684 92 815 26,0 % Taiwan 2 409 2 688 11,6 % 57 592 78 714 36,7 % Israel 2 365 2 108
59 092 62 646 6,0 % Vietnam 1 633 2 084 27,6 % 27 149 53 356 96,5 % Switzerland 1 778 1 828 2,8 % 52 279 64 289 23,0 % Thailand 2 735 1 949
59 649 54 936
Singapore 1 956 1 775
53 587 55 266 3,1 % Turkey 1 793 1 555
43 769 44 844 2,5 % Belarussia 957 810
15 948 18 483 15,9 % Australia 900 645
34 165 26 394
South Africa 776 644
21 433 20 086
Kazakhstan 691 489
16 170 13 096
Other countries 4 221 4 816 14,1 % 125 062 161 404 29,1 % Total "Others" 45 583 41 521
1 041 687 1 211 239 16,3 %
Figures as per 28.07.09 Source: NSEC
34
(Volume in tons WFE, value in thousand NOK)
Figures as per 12.08.09 Source: NSEC
Volume 2008 Volume 2009 Change Value 2008 Value 2009 Change EU 291 135 312 167 7,2 % 7 144 850 9 148 414 28,0 % Others 52 875 48 719
1 222 201 1 457 748 19,3 % Japan 14 177 15 723 10,9 % 400 179 534 866 33,7 % Russia 33 178 35 292 6,4 % 774 262 949 222 22,6 % USA 5 797 19 391 234,5 % 188 325 679 215 260,7 % In total 397 162 431 292 8,6 % 9 729 817 12 769 465 31,2 %
35
in tons WFE
Figures as per 12.08.09 Source: Kontali / Lerøy
36
Figures as per 12.08.09 Sources: NSEC / Kontali / FHL MT = Metric Ton = 1 Ton
Norway total export volume of Atlantic Salmon (431,292 MT WFE) + 8.6 % Norway total export value of Atlantic Salmon (NOK12,769m) + 31.2 % Norway – EU (volume Atlantic Salmon) (312,167 MT WFE) + 7.2 % Norway – EU (value Atlantic Salmon) (NOK9,148m) + 28.0 % Norway – Russia (volume Atlantic Salmon) (35,292 MT WFE) + 6.4 % Norway – USA (volume Atlantic Salmon) (19,391 MT WFE) + 234.5 % Sales of fish-feed in Norway as per July 09 (616,400 MT) + 14.5 %
37
value
38