
SLIDE 1
1
SAS Q4 2013/2014
December, 2014
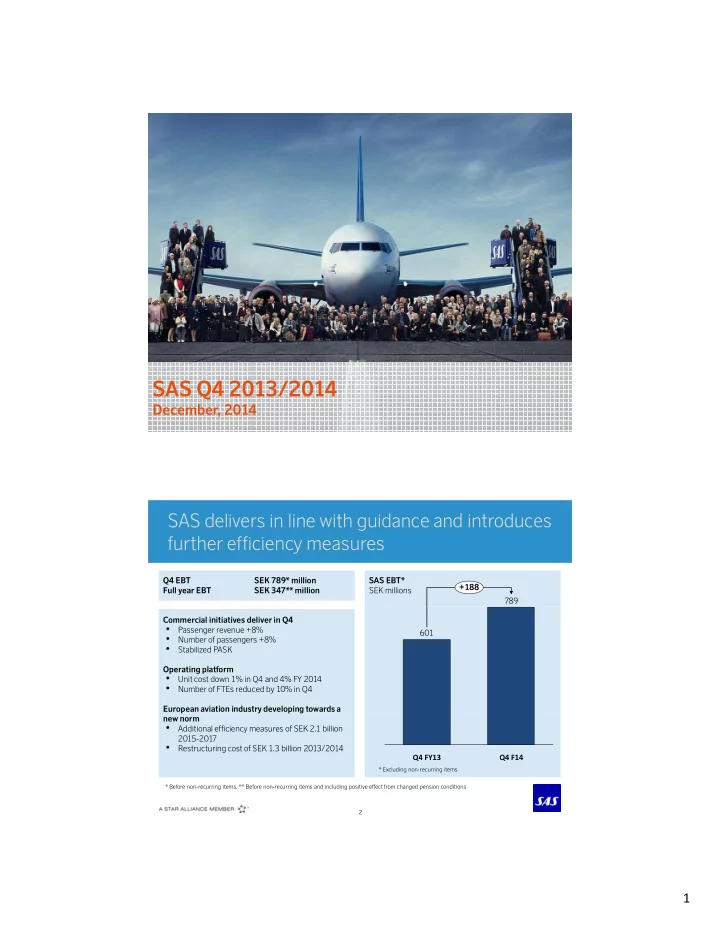
SAS delivers in line with guidance and introduces further efficiency measures
Q4 EBT SEK 789* million Full year EBT SEK 347** million SAS EBT* SEK millions 789 +188 789 Commercial initiatives deliver in Q4
- Passenger revenue +8%
- Number of passengers +8%
- Stabilized PASK
Operating platform
- Unit cost down 1% in Q4 and 4% FY 2014
- Number of FTEs reduced by 10% in Q4
European aviation industry developing towards a 601 601
2
p y p g new norm
- Additional efficiency measures of SEK 2.1 billion
2015-2017
- Restructuring cost of SEK 1.3 billion 2013/2014
* Excluding non-recurring items
Q4 F14 Q4 FY13
* Before non-recurring items, ** Before non-recurring items and including positive effect from changed pension conditions