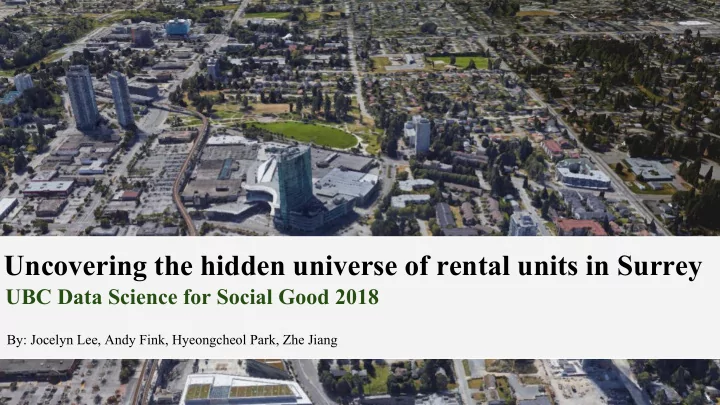

Uncovering the hidden universe of rental units in Surrey UBC Data Science for Social Good 2018 By: Jocelyn Lee, Andy Fink, Hyeongcheol Park, Zhe Jiang
Overview • Introduction • Data Sources and Collection • Data Processing • Classification Model Results • Discussion and Future Work
The Hidden Housing Market • Surrey is growing at a rapid rate • Rental unit information for Surrey is incomplete • Social consequences: • School overpopulation • Inadequate public transportation availability • Lack of available street parking • Unsafe secondary suite rentals • Goal: provide the City of Surrey with up to date information on the type , distribution and amount of secondary suites
Data Sources Open Sources: Non-Open Sources:
Data Collection Different web crawlers built for different websites: ● Most postings from Craigslist: 3,000~4,000 raw data monthly ○ Other sources (mainly Kijiji and VRBO) comprise ~300 data monthly ○ Short-term rental very few: VRBO and Airbnb ○ Crawler deployed on UBC server and collects data every day ● Current research was mainly based on data collected over the past 3 ● months
Data Cleaning & Processing • Excluded non-Surrey region: latitude-longitude(GIS), title, location, url • Standardization • Deduplication • Set Theory (Deterministic Record Linkage) • Fuzzy Matching (Probabilistic RL) • Missing value imputation for supervised-learning
Manually Labelled Data and Proportions Categories of Rental % of Listings Non-market Rental 0 Purpose-built 0.8 Entire Condo 13.9 Entire House or Townhouse 25.0 Basement Secondary Suite 22.1 Non-basement Secondary Suite 6.8 Laneway or Coach House 1.4 Unspecified Secondary Suite 4.5 Individual Rooms in a Condo or House 19.8 Non-housing Postings 5.7
Classification Example “ I am a student Punjabi girl. I need someone international Punjabi student to share my one bedroom basement . Internet included no laundry. Available immediately.”
Problems with Such Classification It consumes too much to do manual labeling: ● So we built automatic classifiers . ● With the 1000-entry labeled dataset we had: ● Some of the 10 classes had too few categories; ○ 1000 entries were not supportive enough to train a model ○ to classify 10 categories; Shall we condense the current categories into fewer? ●
3 Category Classification • Solution: Collapse into 3 categories: • 1 - Entire House or Condo 39.7% • 2 - Secondary Suites 34.8% • 3 - Individual Rooms 19.8% (Non-housing ads excluded)
Final Classification Results • From the Random Forest Classifier Category % Predicted % Labelled 1 - Entire House or Condo 39.2 41.8 2 - Secondary Suites 37.6 37.0 3 - Individual Rooms 23.2 21.2 • Prediction Accuracy: 91% with an out of bag error of 11%
Spatial Distribution of Online Postings • Maps created using QGIS 3.2.3 • Counts measured using Dissemination Areas • Highest posting densities in Douglas and City Center, high density in Cloverdale % of online posts per DA
Spatial Distribution of Online Postings Private Room Secondary Suite Entire Property
Spatial Distribution of Manually Classified Set • Manually classified set • Each dot represents an individual posting • Noticeable clusters in City Centre, Cloverdale and South Surrey
Cluster Examples Entire Houses Condos Coach/Laneway Houses Basement/Private Rooms
Discussion Current dataset for supervised learning is small: ● Distribution of categories might be different in real situation; ○ Classifier model possibly overfitting; ○ Data was collected over only 3 months; ● Two other models were not ensembled, could have been used to ● increase accuracy.
Future Work Validation and analysis over a time-series; ● Pipeline development: a set of user-friendly automatic tools; ● More robust classifiers with Natural Language Interpretation: ● ○ Better data imputation: from addresses, descriptions ○ More features generated from titles/descriptions ○ Ensembled methods
Thanks for watching! Questions?
Final Classification Results
Other Classification Results • From the Naive Bayes Model (without normalization) Category % Predicted % Labelled 1 - Entire House or Condo 28.07 39.7 2 - Secondary Suites 46.04 34.8 3 - Individual Rooms 20.89 19.8 • Prediction Accuracy: 75%
Other Classification Results • From the Generalized Additive Model with Majority Voting Category % Predicted % Labelled 1 - Entire House or Condo 46.0 41.8 2 - Secondary Suites 37.0 37.0 3 - Individual Rooms 16.9 21.2 • Prediction Accuracy: 82.53%
Recommend
More recommend