
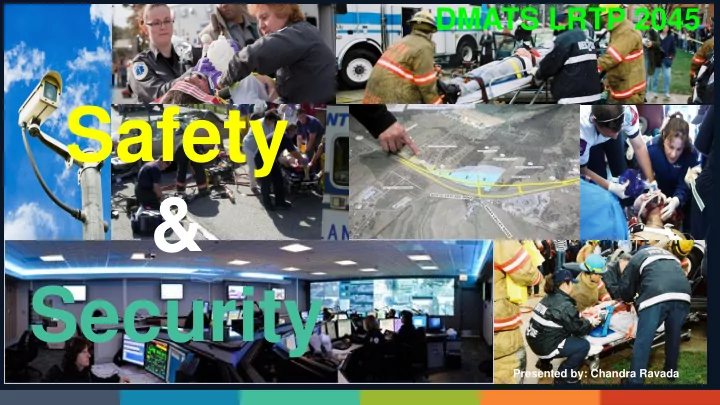
SLIDE 1
Safety & Security
Presented by: Chandra Ravada
DMATS LRTP 2045
Safety & Security Presented by: Chandra Ravada FAST ACT - - PowerPoint PPT Presentation
DMATS LRTP 2045 Safety & Security Presented by: Chandra Ravada FAST ACT Safety & Security Increase the safety of the transportation system for motorized and non-motorized users Increase the security of the transportation system
Presented by: Chandra Ravada
DMATS LRTP 2045
Increase the safety of the transportation system for motorized and non-motorized users
Increase the security of the transportation system for motorized and non-motorized users
US FATAL CRASHES
24.9%
1.46 1.42 1.36 1.26 1.15 1.11 1.10 1.14 1.10 1.07 5,000 10,000 15,000 20,000 25,000 30,000 35,000 40,000 45,000 50,000 2005 2006 2007 2008 2009 2010 2011 2012 2013 2014 FATALITIES Fatalities Per 100 Million Vehicle Miles TraveledThe fatality data for 2014 placed the highway death count at 32,675 — a drop of 24.90 percent — compared to the 43,510 deaths reported in 2005.
Steady decline in Fatalities Per 100 Million Vehicle Miles Traveled.
DMATS TRAFFIC SAFETY DATA
Annual Average 55 fatalities, 289 major injuries, and 1,725 minor injuries There was a spike in crashes in 2007, but the region showed a decline in accident rates in recent years.
201 192 168 154 176 170 157 141 137 160 147 128 138 243 301 284 317 268 251 287 264 278 279 230 238 204 813 1,034 1,063 1,046 1,153 1,223 1,330 1,248 1,141 1,240 1,179 1,201 1,286 200 400 600 800 1,000 1,200 1,400 1,600 1,800 2001 2002 2003 2004 2005 2006 2007 2008 2009 2010 2011 2012 2013
Injuries Unknown Injury Property Damage
Overall Injuries and Unknown injuries decreased and Property Damage crashes increased from 2001 to 2013
5
www.yoursite.com The Dubuque County fatality rate of 9.34 was lower than the state and national rates of 10.25 and 10.33 respectively. In fact, over the past five years, fatality rates in the DMATS area have been consistently lower than state and national rates.
FATATALITIES PER 100,000 POPULATION
Comparison between Nation, Iowa State and Dubuque Co.
14.7 14.3 13.7 12.3 11.0 10.7 10.4 10.8 10.4 10.3 15.3 14.8 15.0 13.8 12.4 12.8 11.8 11.9 10.3 10.3 9.9 8.8 9.8 7.6 7.5 7.5 3.2 5.3 4.2 9.3
2 4 6 8 10 12 14 16 18 2005 2006 2007 2008 2009 2010 2011 2012 2013 2014Fatalities Per 100,000
US State of Iowa Dubuque County Dubuque CountyThe Dubuque County fatality rate doubled in 2014 when compared to 2011 to 2013 rates.
Chapter 6: Safety & Security
Multi-Disciplinary Safety Team (MDST)
1.Deal with safety issues as a Team 2.Make a group decision rather than each individual agency decision. 3.Utilize data from all sources to make a decision. 4.Make the group involved with City and MPO Long Range Planning process.
7
www.yoursite.com
IOWA STRATEGIC HIGHWAY SAFETY PLAN
DMATS will examine, evaluate, and implement the regional strategies contained in the Iowa Strategic Highway Safety Plan
Policy
Public agencies must choose the messages they will focus efforts
Education
Education involves informing users about unsafe behaviors and suggesting ways to improve safety when they use the transportation system. .
education campaign
Enforcement
Law enforcement officers play a valuable role in maintaining the region’s transportation safety and security.
Engineering
Local public works departments
transportation often implement engineering strategies to improve roadway safety.
Research & Data
Data is the foundation of a strategic plan to reduce fatalities and major injuries.
education
enforcment
art techonology
enforcement programs
departure crashes
Intresections
multiagency collaborative efforts
legislative policies
improvement
Chapter 6: Safety & Security
8
www.yoursite.com
1
COMMUNICATION PLAN
Priority strategies develop a strategic communication plan integrating the Toward Zero Deaths initiative, called Zero Fatalities. .
EDUCATION SAFETY AREA
Multimedia education campaign & Enhance drivers education
2
MULTIMEDIA NETWORK
Deliver safety messages to multimedia networks (television, radio, newspaper, social media).
3
INVOLVE PARENTS
Involve parents in driver education courses.
4
BEHIND THE WHEEL
Require more behind-the wheel instruction time.
5
DIVERSITY OF DRIVING
Require a diversity of driving conditions (all weather conditions, daytime and nighttime, all road surfaces).
Chapter 6: Safety & Security
9
www.yoursite.com
ENGINEERING SAFETY AREA
Prevent lane departure crashes & Improve Intersections
STRATEGIES
Chapter 6: Safety & Security
Prevent lane departure crashes
Urban
Rural
Improve Intersections
10
www.yoursite.com
ENFORCEMENT SAFETY AREA
High visibility enforcement, deploy state-of-the-art technology & expand impaired enforcement programs
High visibility enforcement
messages.
technology for compliance.
information.
.
Deploy state-of-the-art technology
identify impaired drivers.
DOT’s Office of Motor Vehicle Enforcement.
Expand impaired enforcement programs
Chapter 6: Safety & Security
STRATEGIES
11
www.yoursite.com
1
MULTIAGENCY GROUP
Create a multiagency group to carry out safety strategies across the Five E’s.
POLICY SAFETY AREA
Enhance multiagency collaborative efforts &Strengthen legislative policies
2
ENGAGE PROFESSIONALS
Engage professionals across disciplines and systems to participate and create a unified message.
3
SEAT BELT LEGISLATION
Enact primary seat belt legislation for all positions.
4
CARELESS DRIVING LAW
Modify careless driving law to include distracted driving as a primary offense.
5
DRIVER’S LICENSING
Enhance graduated driver’s licensing.
6
Chapter 6: Safety & Security
IMPAIRED DRIVING
Tighten impaired driving tolerances and increase penalties for impaired driving violations.
12
www.yoursite.com
RESEARCH AND DATA SAFETY AREA
121 Major Injuries (2004-2013) 22 Fatalities (2004-2013)Chapter 6: Safety & Security
10 Fatalities (2004-2013) 29 Major Injuries (2004-2013) 56 Minor Injuries (2004-2013) 22 Unknown Injuries (2004-2013)Safety data improvement
STATEWIDE ELECTRONIC CRASH
Expand statewide electronic crash reporting through TRACS.
DEVELOP A WEB PORTAL
Develop a Web portal to increase safety data availability.
WEB BASED ANALYTICAL TOOL
Support creation of a web based analytical tool.
EVACUATION PLAN MAPS
A detailed planning effort prior to an incident is key to safe evacuation
MAJOR
Emergency personnel within the Dubuque Metropolitan Area recognize that a successful evacuation, particularly an evacuation of a large portion of the population, encompasses more than physically moving a population from the area at risk to a safe area.
EVCUATION DISTRICT BOUNDARIES POTENTIAL EVCUATION ROUTES SCHOOLS & SPECIAL NEEDS FACILITIES
PARTNERS
PURPOSE OF THE PROJECT
Synchronizing signals into one signal system and creating signal timing scenarios by time of day (peak and off peak) and events (crashes or
PERFORMANCE MEASURES
The project can be measured by using the data collected in the metropolitan area
PART I: CONNECTIVITY
The goal of Part One is to connect all signalized corridors and create scenarios for peak, off peak, and events by using data from Smarter Phone, Airsage, DMATS Model and INRIX.
Part II: Adaptation
The goal of Part II is built on Part I and creates an automated adaptive
based on the data transmitted to the Command Center.
SPECIAL INITIATIVES
Local governments are currently partnering to implement special initiatives within the region
NEXT STEPS
Review the documents and provide your comments by April 14th, 2016
NEW IDEAS
Feel free to share any new ideas that can help
EMS TEAMS
How to involve our EMS teams in planning process rather than at implementation process
1 2 3
UNBOXING IDEAS
Outside the box ideas will help the region to meet future needs.