
1
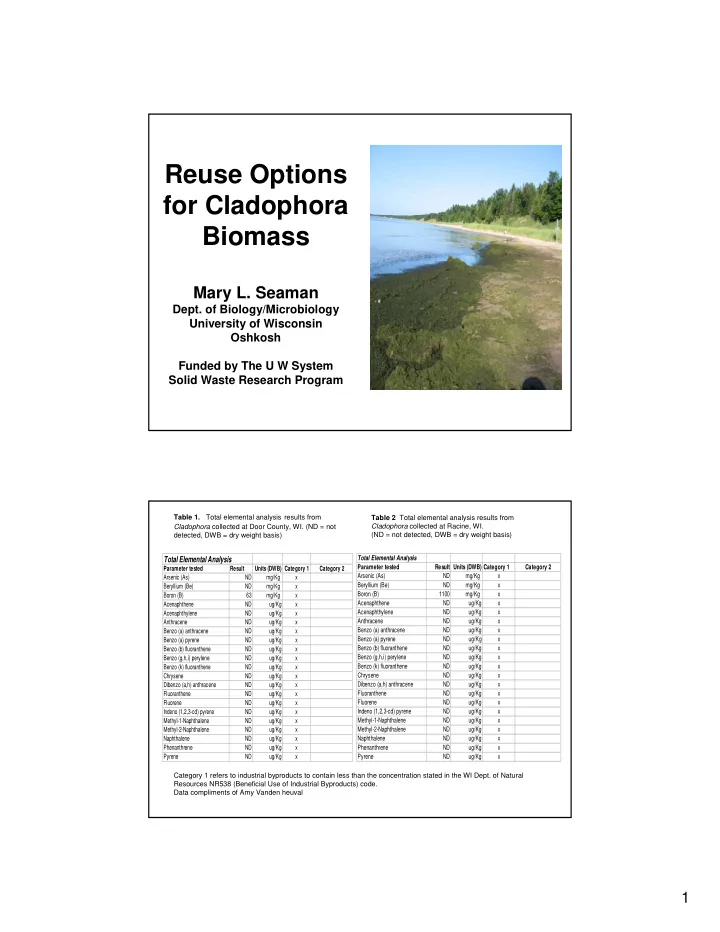
Reuse Options for Cladophora Biomass
Mary L. Seaman
- Dept. of Biology/Microbiology
University of Wisconsin Oshkosh Funded by The U W System Solid Waste Research Program
Total Elemental Analysis
Parameter tested Result Units (DWB) Category 1 Category 2 Arsenic (As) ND mg/Kg x Beryllium (Be) ND mg/Kg x Boron (B) 63 mg/Kg x Acenaphthene ND ug/Kg x Acenaphthylene ND ug/Kg x Anthracene ND ug/Kg x Benzo (a) anthracene ND ug/Kg x Benzo (a) pyrene ND ug/Kg x Benzo (b) fluoranthene ND ug/Kg x Benzo (g,h,i) perylene ND ug/Kg x Benzo (k) fluoranthene ND ug/Kg x Chrysene ND ug/Kg x Dibenzo (a,h) anthracene ND ug/Kg x Fluoranthene ND ug/Kg x Fluorene ND ug/Kg x Indeno (1,2,3-cd) pyrene ND ug/Kg x Methyl-1-Naphthalene ND ug/Kg x Methyl-2-Naphthalene ND ug/Kg x Naphthalene ND ug/Kg x Phenanthrene ND ug/Kg x Pyrene ND ug/Kg x Total Elemental Analysis Parameter tested Result Units (DWB) Category 1 Category 2 Arsenic (As) ND mg/Kg x Beryllium (Be) ND mg/Kg x Boron (B) 1100 mg/Kg x Acenaphthene ND ug/Kg x Acenaphthylene ND ug/Kg x Anthracene ND ug/Kg x Benzo (a) anthracene ND ug/Kg x Benzo (a) pyrene ND ug/Kg x Benzo (b) fluoranthene ND ug/Kg x Benzo (g,h,i) perylene ND ug/Kg x Benzo (k) fluoranthene ND ug/Kg x Chrysene ND ug/Kg x Dibenzo (a,h) anthracene ND ug/Kg x Fluoranthene ND ug/Kg x Fluorene ND ug/Kg x Indeno (1,2,3-cd) pyrene ND ug/Kg x Methyl-1-Naphthalene ND ug/Kg x Methyl-2-Naphthalene ND ug/Kg x Naphthalene ND ug/Kg x Phenanthrene ND ug/Kg x Pyrene ND ug/Kg x
Table 2 Total elemental analysis results from Cladophora collected at Racine, WI. (ND = not detected, DWB = dry weight basis) Table 1. Total elemental analysis results from Cladophora collected at Door County, WI. (ND = not detected, DWB = dry weight basis) Category 1 refers to industrial byproducts to contain less than the concentration stated in the WI Dept. of Natural Resources NR538 (Beneficial Use of Industrial Byproducts) code. Data compliments of Amy Vanden heuval