Update on Phosphorus and Cladophora in the Lake Michigan Nearshore - - PDF document

update on phosphorus and cladophora in the lake michigan
SMART_READER_LITE
LIVE PREVIEW

Update on Phosphorus and Cladophora in the Lake Michigan Nearshore - - PDF document

Update on Phosphorus and Cladophora in the Lake Michigan Nearshore Zone Harvey Bootsma Nearshore TP and TDP Concentrations Since 1980, Near Milwaukee Harbor 30 Total Dissolved P Total P 25 19.4 20 [P] ( g L -1 ) 14.5 15 12.5 12.6


slide-1
SLIDE 1

1

Update on Phosphorus and Cladophora in the Lake Michigan Nearshore Zone

Harvey Bootsma

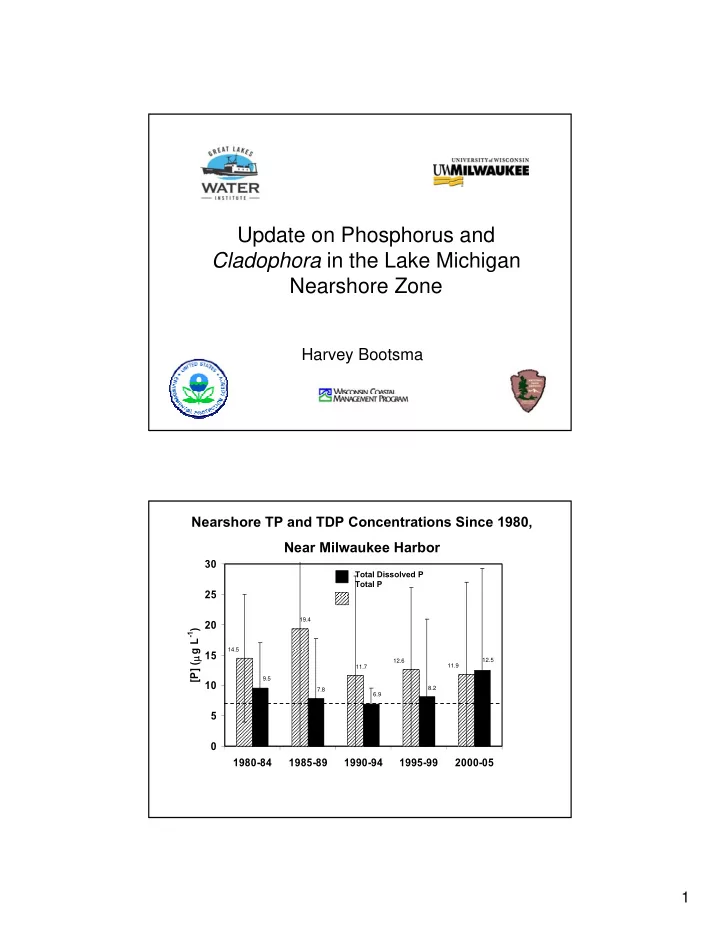
5 10 15 20 25 30 1980-84 1985-89 1990-94 1995-99 2000-05 [P] (μ g L-1)

Total Dissolved P Total P

14.5 9.5 19.4 7.8 11.7 6.9 12.6 8.2 11.9 12.5

Nearshore TP and TDP Concentrations Since 1980, Near Milwaukee Harbor

slide-2
SLIDE 2

2

Spring Total P

(mean of all pelagic stations)

1 2 3 4 5 6 7 1983 1984 1985 1986 1987 1988 1989 1990 1991 1992 1993 1994 1995 1996 1997 1998 1999 2000 2001 2002 2003 2004 2005 Total P (μg/L)

Michigan Huron

GLWQA Target for Lake Michigan: 7 μg/L 0.05 0.1 0.15 0.2 0.25 0.3

1 / 1 / 8 2 1 / 1 / 8 3 1 / 1 / 8 4 1 2 / 3 1 / 8 4 1 / 1 / 8 6 1 / 1 / 8 7 1 / 1 / 8 8 1 2 / 3 1 / 8 8 1 / 1 / 9 1 / 1 / 9 1 1 / 1 / 9 2 1 2 / 3 1 / 9 2 1 / 1 / 9 4 1 / 1 / 9 5 1 / 1 / 9 6 1 2 / 3 1 / 9 6 1 / 1 / 9 8 1 / 1 / 9 9 1 / 1 / 0 0 1 2 / 3 1 / 0 0 1 / 1 / 0 2

mg/L

SRP TP

82 83 84 85 86 87 88 89 90 91 92 93 94 95 96 97 98 99 00 01

20-Year Phosphorus Trend at River Junction

Data Source: MMSD

slide-3
SLIDE 3

3

0.1 0.2 0.3 0.4 0.5 0.6 0.7 0.8 1980 1985 1990 1995 2000 2005 Dissolved P : Total P Ratio

In Milwaukee River, dissolved P is becoming a larger fraction of TP

1 2 3 4 5 1970 1975 1980 1985 1991 1994 1995

Average [P] (ppm) Soil P Storage Change (kg ha-1)

P in Wisconsin Cropland

Bundy and Sturgul 2001

10 20 30 40 50 60 1968- 73 1974- 77 1978- 81 1982- 85 1986- 90 1991- 94 1995- 99

slide-4
SLIDE 4

4

SRP (μg L-1) Milwaukee River Transect, April 2005

20 40 60 80

1 2 3 4 5 6 7 8 9 10

infotrek.er.usgs.gov/.../ milwaukeemap.gif

50 100 150 200 250

J F M A M J J A S O N D

50 100 150 200 250

J F M A M J J A S O N D

50 100 150 200 250 J F M A M J J A S O N D J F M A M J J A S O N D J F M A M J J A S O N D

1982-87 Mean = 102 1988-95 Mean = 72 1996-2001 Mean = 120

Total P (μg L-1) Milwaukee River TP Concentrations have increased in late spring.

slide-5
SLIDE 5

5

5 10 15 20 25 30 35 40 J F M A M J J A S O N D 5 10 15 20 25 30 35 J F M A M J J A S O N D 5 10 15 20 25 30 35 J F M A M J J A S O N D

m3 s-1 1982-87

  • Avg. = 18.4

Milwaukee River Discharge 1996-2001

  • Avg. = 14.3

1988-95

  • Avg. = 13.1

5 10 15 20 25 1981 1986 1991 1996 2001

Annual Means

Data source: USGS

slide-6
SLIDE 6

6

10 km

Milwaukee R.

Kinnickinnic R.

Menomonee R.

10 km Milwaukee region Nearshore Phosphorus loads, May – July 2006

C l a d

  • p

h

  • r

a z

  • n

e

River load: 120 mg P m-2 Mussel Excretion: 506 mg P m-2

slide-7
SLIDE 7

7

The Lake Michigan The Lake Michigan Phosphorus Cycle Phosphorus Cycle

P Load Outflow

Phytoplankton Fish Zooplankton

Burial

DP DP

Nearshore Loop Offshore Loop

Mussel invasion Mussels have made nearshore water clear

Source: MMSD

slide-8
SLIDE 8

8

November 2007 November 2008

slide-9
SLIDE 9

9

1 2 3 4 5 6 7 8 9 10 TDP (mg/L)

May June July Aug. Sep. Oct. 2006 2007 2008 Near-Bottom Total Dissolved Phosphorus Atwater, Lake Michigan TDP (μg/L)

5 10 15 20 25 Temperature (

  • C)

Apr May Jun Jul Aug Sep Oct Nov 2006 2008 Water Temperature at 9 m

slide-10
SLIDE 10

10

4 5 6 7 8 9 10 11 12 13 14 1970 1975 1980 1985 1990 1995 2000 2005 June - August Mean T (oC)

Lake Michigan Nearshore Summer Temperature Trend

Optimum for Cladophora growth no Cladophora growth

TEMPERATURE

PHOSPHORUS Cladophora Quagga Mussel

slide-11
SLIDE 11

11

0.002 0.004 0.006 0.008 0.01 0.012 0.014 0.016 0.018 0.02 5 10 15 20 25 30 Food Concentration (mg P ml

  • 1)

μgP mgDW-1 hr-1

Lab Experiments: Phosphorus Excretion by Quagga Mussels

10oC 15oC 22oC 50 100 150 200 250 300 350 400 5 10 15 20 25 30 35 Temperature (oC) Biomass (gDW m-2) 0.02 0.04 0.06 0.08 0.1 0.12 0.14 0.16 0.18 0.2 Growth Rate (day-1) B μ no mussels mussels

slide-12
SLIDE 12

12

LIGHT ?

  • 0.1
  • 0.05

0.05 0.1 0.15 0.2 Clean Mussels Dirty Mussels Mussels + Cladophora

P Flux Between Mussels and Cladophora

μg P mussel-1 hr-1

slide-13
SLIDE 13

13

Current Needs

  • 3. What is the botulism mechanism?

Photo: Alice Van Zoeren

slide-14
SLIDE 14

14

4 minutes after dye injection

slide-15
SLIDE 15

15

above mussels mussel bed K = 0.1 cm2 s-1 K = 0.01 cm2 s-1

0.2 0.4 0.6 0.8 1 1.2

  • 1000

1000 3000 5000 7000 O2 uptake rate (mg m-2 d-1)

Depth of anoxic zone in mussel bed

Effect of benthic respiration on thickness of anoxic layer

slide-16
SLIDE 16

16

slide-17
SLIDE 17

17

7 7.5 8 8.5 9 9.5 10 50 100 Time (minutes) DO (% Sat.) Benthic O2 uptake by mussels 5,258 mg O2 m-2 d-1

0.2 0.4 0.6 0.8 1 1.2

  • 1000

1000 3000 5000 7000 O2 uptake rate (mg m-2 d-1)

Depth of anoxic zone in mussel bed (cm)

Effect of benthic respiration on thickness of anoxic layer

slide-18
SLIDE 18

18

above mussels mussel bed K = 0.1 cm2 s-1 K = 0.01 cm2 s-1

Underwater Particle Image Velocimetry (PIV) System

slide-19
SLIDE 19

19

PIV Image Analysis Results

Qian and Bootsma, in press

slide-20
SLIDE 20

20

10 20 30 40 50 60 10 20 30 40 50

[SRP] (nmol l-1) Height (mm) Vertical Soluble Reactive Phosphorus Profile Over Mussel Bed

dz dc D F =

The Cladophora Solution

slide-21
SLIDE 21

21

Bruce Mozert / University of Florida Press