PORT VALDEZ WEATHER BUOY DEPLOYMENT UPDATE VMT WEATHER BUOY - - PDF document

port valdez weather buoy deployment update
SMART_READER_LITE
LIVE PREVIEW

PORT VALDEZ WEATHER BUOY DEPLOYMENT UPDATE VMT WEATHER BUOY - - PDF document

9/19/19 PORT VALDEZ WEATHER BUOY DEPLOYMENT UPDATE VMT WEATHER BUOY BACKGROUND INFORMATION Location: VMT off of Jackson Point between Berths 1 and 3 Date Deployed: May 16, 2019 Information provided: Current speed and


slide-1
SLIDE 1

9/19/19 1

PORT VALDEZ WEATHER BUOY DEPLOYMENT UPDATE

VMT WEATHER BUOY BACKGROUND INFORMATION

  • Location: VMT off of Jackson Point between Berths 1 and 3
  • Date Deployed: May 16, 2019
  • Information provided:

§ Current speed and direction § Wind speed and direction § Wave height and direction § Barometric pressure § Air temperature Refresh frequency: the buoy information refreshes every 15 minutes

Data collected by the buoy is stored by PWSRCAC’s contractor and is available to the public at: http://www.pwswx.pwssc.org/MOB 1/MOB1.html

slide-2
SLIDE 2

9/19/19 2

PRELIMINARY WEATHER BUOY DATA

  • VMT weather buoy data from mid-May to mid-July shows current, wind and waves

predominantly moving east toward the SGH and VDF, but the current direction varies at times to the west with tidal changes (see current, wind, and wave roses)

  • Based on oil spill response experience and guidance, the Rule of Thumb for spilled
  • il transport on water is at 100% of current speed and direction and 3% of wind

speed and direction Note: Current, wind, and wave roses are read from the center out toward the colored spokes to indicate the direction of each weather parameter. The brighter colors indicate higher/stronger values for each weather parameter.

CURRENT SPEED AND DIRECTION (MID-MAY – MID JULY)

  • Maximum current speed in May was 1.2 nautical miles per hour (kts) to the ENE
  • Maximum current speed measured in June and July was 1.5 kts to the ENE
  • Using the Rule of Thumb, at 1.5 kts of current speed in an ENE direction, oil spilled from

the VMT would reach the SGH in just over an hour and the VDF in less than 3 hours

slide-3
SLIDE 3

9/19/19 3

WIND SPEED AND DIRECTION (MID MAY – MID JULY)

  • Maximum wind speed (gusting) was measured in May at 38 kts to the ENE
  • Maximum wind speed (gusting) was measured in June at 59 kts to the ENE
  • Maximum wind speed (gusting) was measured in July at 39 kts to the ENE
  • Predominant wind direction and speed was to the ENE for all three

months and therefore would transport spilled oil 3% of the wind speed in in the direction of the SGH and VDF

  • This 3% speed increase from wind speed and

direction would be added to the 100% of the current speed and direction that is transporting the oil in the same ENE

  • direction. If wind direction was opposite to

current direction it would be subtracted from current speed.

WAVE HEIGHT AND DIRECTION (MID MAY – MID JULY)

  • Maximum wave height was 2.8 feet in May, 3.1 feet in June, and 2.2

feet in July

  • Predominant wave direction was to the ESE for all three months
slide-4
SLIDE 4

9/19/19 4

CURRENT SPEED AND DIRECTION (MID JULY – 6 SEPTEMBER)

  • Maximum current speed between 7/9/2019 and 8/9/2019 was 1.6 kts to the ENE
  • Maximum current speed for the month of August was 1.4 kts to the ENE and for the month of September

through September 6th it was .81 kts to the ENE. The data also shows even more variability (direction and strength) with tides in early September.

  • Using the Rule of Thumb, at 1.6 kts of current speed in an ENE direction, oil spilled from the

VMT would reach the SGH in a little more than 1 hour and the VDF in less than 3 hours. Using .81 kts of current speed in an ENE direction, oil spilled from the VMT would reach the SGH in less than 3 hours and the VDF in less than 5 hours.

WIND SPEED AND DIRECTION (MID JULY – 6 SEPTEMBER)

  • Maximum wind speed (gusting) for the month of August was over 100 kts and for the

month of September through September 6th was measured at 27 kts.

  • Predominant wind direction and speed was to the ENE from mid-May to mid-July.

However, the predominant wind direction shifted more to the west toward the end of July, August, and into early September, but the direction shifts back to the ENE at certain times

  • f the day.
slide-5
SLIDE 5

9/19/19 5

WAVE HEIGHT AND DIRECTION (MID JULY – 6 SEPTEMBER)

  • Maximum wave height for the month of August was 3 feet and for the month of September

through September 6th was 1.5 feet.

  • Predominant wave direction has been consistent to the ESE from deployment in mid-May

to present.

CONCLUSIONS FROM PRELIMINARY VMT BUOY DATA

  • Current, wind, and wave direction as measured by the VMT weather buoy show a predominantly easterly direction for

all three parameters from mid-May to mid-July, 2019, however, predominant wind direction shifted to the west toward the end of July, August, and so far through early September, but with variability to the ENE at certain times of the day. There continues to be current speed and direction variability with tide changes. Wave direction has been consistently in an ESE direction since the buoy was installed in mid-May.

  • Based on this data, if there was an oil spill at the VMT, oil and oil sheen would be transported to the east toward the

SGH andVDF at ~100% of current speed and direction and ~3% of wind speed and direction.

  • The preliminary VMT weather buoy data identifies inaccuracies in Alyeska’s OilMap modeling for Scenario 4 spill

trajectories that show oil remaining at the VMT or moving in a westerly direction away from the SGH and VDF for ~60 hours.

  • Tides in Port Valdez change every 6 hours, and with each tidal change, spilled oil spreads and is transported further

from the source in all directions, but predominantly to the east in the direction of the SGH andVDF.

slide-6
SLIDE 6

9/19/19 6

VALDEZ DUCK FLATS WEATHER BUOY UPDATE

  • All required permits from the U.S. Army Corps of Engineers (USACE), U.S.

Coast Guard (USCG), and Alaska Department of Natural Resources (ADNR) are approved and in place.

  • PWSRCAC and the PWS Science Center successfully deployed the second

weather buoy at theValdez Duck Flats on September 6, 2019.

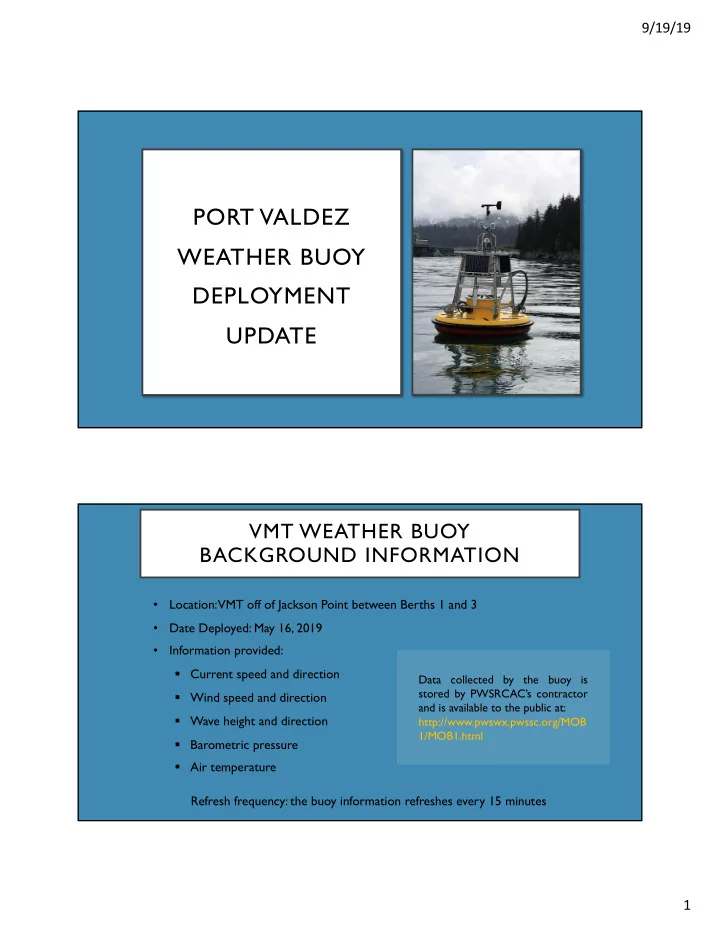
  • This buoy is identical to the buoy that has been deployed at the VMT since May

16, 2019, and provides the same weather information.

  • Data collected by the

Valdez Duck Flats buoy is stored by PWSRCAC’s contractor and is available to the public at: http://www.pwswx.pwssc.org/MOB2/MOB2.html

FUTURE PLANS

  • Data from both weather buoys will be collected over the next 5 years to help determine seasonal current and wind patterns

in Port Valdez. This information is needed to enhance oil spill preparedness and response and to help ensure the VDF and SGH are protected before they are oiled during a spill.

  • PWSRCAC and PWS Science Center are working with the National Oceanic and Atmospheric Administration (NOAA) to

integrate the weather data from the VMT and Valdez Duck Flats buoys into NOAA’s Alaska Ocean Observing System (AOOS) as well as their Physical Oceanographic RealTime System (PORTS).

  • NOAA PORTS is an information system that measures and disseminates oceanographic and meteorological data that

assists mariners with navigation safely.

  • AOOS represents a network of critical ocean and coastal observations, data, and information products that aid in

understanding of the status of Alaska's marine ecosystem and allows stakeholders to make better decisions about their use of the marine environment.

  • Integration of weather data from these two buoys into NOAA’s AOOS and PORTS systems will significantly increase public,

agency, and stakeholder access to this information to help inform navigation safety and oil spill response decisions.

slide-7
SLIDE 7

9/19/19 7

QUESTIONS?