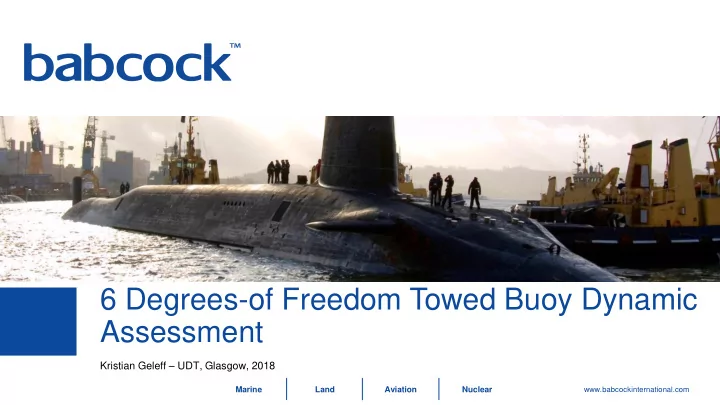

6 Degrees-of Freedom Towed Buoy Dynamic Assessment Kristian Geleff – UDT, Glasgow, 2018 Marine Land Aviation Nuclear www.babcockinternational.com
UDT 2018 Introduction 6 Degrees-of Freedom Towed Buoy Dynamic Assessment • Introduction of the system • Purpose of developing this capability • Challenges • Simulation • Key Performance Indicators • Conclusion 2 UDT, 2018 Marine Land Aviation Nuclear www.babcockinternational.com
UDT 2018 Introduction Environment (waves, wind etc) Wave Affected Zone Operating window Comms at Speed and Depth Water properties Long Towing Cable Speed, depth, manoeuvres Towing Platform 3 UDT, 2018 Marine Land Aviation Nuclear www.babcockinternational.com
UDT 2018 Purpose Provide confidence across a number of areas: • Assess simulation performance against test data • Validation activities • Assess performance impact of design changes • Developmental tool - improve design & performance • Assess performance across wide range of operating scenarios • Time and availability of platforms make this very challenging to achieve with testing • Define operating envelope – interpolate between measured points of data • De-risking tool – increase likelihood of full scale trials being successful 4 UDT, 2018 Marine Land Aviation Nuclear www.babcockinternational.com
UDT 2018 Challenges Scale • Underway towed systems are very large ‒ Towed body to towing platform spans hundreds of meters • No test facilities large enough to accommodate full scale testing • Requires towing platform ‒ Often actual platform due to lack of suitable research platforms • High risk going from the drawing board to full scale tests Tank Testing Hydrodynamic scaling • Different for turbulent transition (Reynolds Number R e ) and wave making resistance (Froude Number F r ) • Not possible to scale for both simultaneously • Scale based on F r and add leading edge trips to artificially trigger turbulent transition at lower Reynolds Numbers. 5 UDT, 2018 Marine Land Aviation Nuclear www.babcockinternational.com
UDT 2018 Challenges Operating Environment • Wind and waves by nature are chaotic and turbulent • Repeatable experiments cannot be achieved • Sea states are characterised in statistical terms i.e. significant wave height, period.. • Statistical methods of analysing performance becomes necessary Wave Elevation Elevation (m) Probability Density -4 -3 -2 -1 0 1 2 3 4 0 500 1000 1500 2000 2500 Standard Deviation Time (s) 6 UDT, 2018 Marine Land Aviation Nuclear www.babcockinternational.com
UDT 2018 Challenges The highly coupled nature of a towed buoy system makes testing of sub-systems and components of limited value. 7 UDT, 2018 Marine Land Aviation Nuclear www.babcockinternational.com
UDT 2018 Challenges • Simulation in the wave affected zone: • Full 6 degree of freedom buoy dynamics required for complex shape • Hydrodynamic coefficients required for all impingement angles • Hydrodynamic scaling challenges Fluid direction (xz plane) 1.5 1 Fluid Velocity (m/s) 0.5 0 -0.5 -1 -1.5 0 1 2 3 4 5 6 7 8 Time (s) 8 Marine Land Aviation Nuclear www.babcockinternational.com
UDT 2018 Simulation 9 UDT, 2018 Marine Land Aviation Nuclear www.babcockinternational.com
UDT 2018 Key Performance Indicators Monitor KPIs: Availability Results: • • Antenna depth Availability (%) • • Antenna orientation Min, max, mean, standard deviation Towed Buoy Depth Operating Window Depth (m) Towed Buoy Depth Mean Upper Depth Bound Lower Depth Bound Minimum Depth Maximum Depth 0 500 1000 1500 2000 2500 Time (s) 10 UDT, 2018 Marine Land Aviation Nuclear www.babcockinternational.com
UDT 2018 Key Performance Indicators Sea State b Sea State b Sea State b Assessment of KPI across Speed Depth Heading Heading Heading (kts) (m) z z z z z z z z z z z z z z z operating scenarios y • y Identify operating scenarios y x y where performance y improvements required y • Quantify performance of y y design changes y x y • y Performance prediction for y end user y y y x Note: Random data used to demonstrate y y visualisation y 11 UDT, 2018 Marine Land Aviation Nuclear www.babcockinternational.com
UDT 2018 Conclusion Challenges facing development of submarine towed buoy systems have been discussed • Full scale testing is expensive and logistically difficult • Scaling effects and highly coupled natured limits value of small scale/sub element testing • Operating environment is chaotic and not easily replicated in a controlled test • Statistical validation Simulation is an enormously valuable tool • Design and development • Cost and risk reduction • Predicting operating envelope • Reducing development timescales • Maximising chance of success for full scale testing 12 UDT, 2018 Marine Land Aviation Nuclear www.babcockinternational.com
UDT 2018 13 UDT, 2018 Marine Land Aviation Nuclear www.babcockinternational.com
Recommend
More recommend