
SLIDE 1
Understanding+and+measuring+of+ accre1on+processes+in+1dal+salt+ marshes+
Inke+Forbrich+ The+Ecosystems+Center+ Marine+Biological+Laboratory+
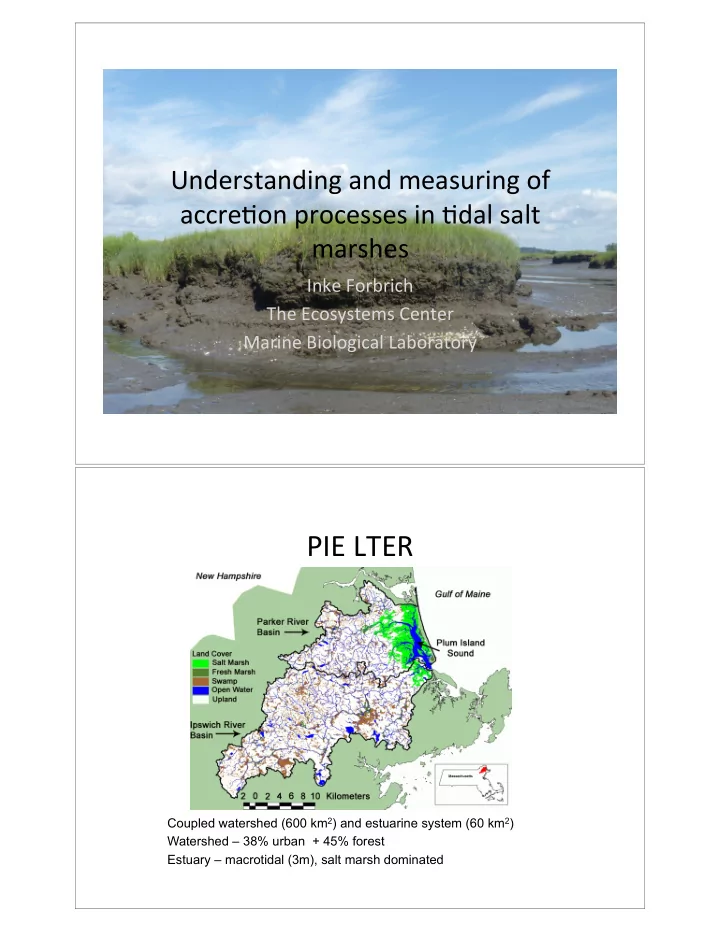
PIE+LTER+
Coupled watershed (600 km2) and estuarine system (60 km2) Watershed – 38% urban + 45% forest Estuary – macrotidal (3m), salt marsh dominated