OVERVIEW PERFORMANCE OF 1. Introduction HOUSES SUBJECTED 2. - - PowerPoint PPT Presentation

overview
SMART_READER_LITE
LIVE PREVIEW

OVERVIEW PERFORMANCE OF 1. Introduction HOUSES SUBJECTED 2. - - PowerPoint PPT Presentation

OVERVIEW PERFORMANCE OF 1. Introduction HOUSES SUBJECTED 2. Project objectives TO BLAST VIBRATIONS 3. Static testing 4. Shaking table specimen design 5. Results - shaking table test 6. Conclusions David Heath 1 Dr. Emad Gad 1,2 Prof. John


slide-1
SLIDE 1

1

PERFORMANCE OF HOUSES SUBJECTED TO BLAST VIBRATIONS

David Heath1

  • Dr. Emad Gad1,2
  • Prof. John Wilson2

1 The University of Melbourne, Victoria, Australia 2 Swinburne University of Technology, Victoria, Australia

  • 1. Introduction
  • 2. Project objectives
  • 3. Static testing
  • 4. Shaking table specimen design
  • 5. Results - shaking table test
  • 6. Conclusions

OVERVIEW INTRODUCTION

  • Australia – world’s largest exporter of coal
  • $22.5 billion (AUD) during 2006 – 2007

(19% commodity exports)

  • Blasting - fracture rock
  • Improves efficiency

“Response of residential structures to blast vibrations”

  • commenced 2000
  • complaints from nearby residents
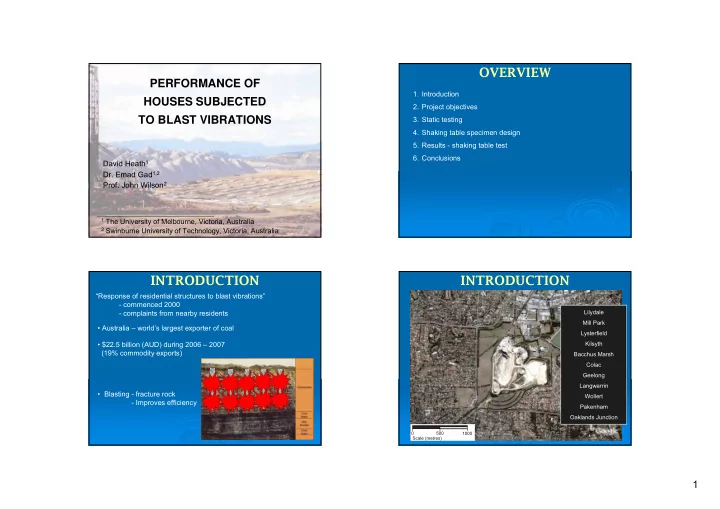
INTRODUCTION

Lilydale Mill Park Lysterfield Kilsyth Bacchus Marsh Colac Geelong Langwarrin Wollert Pakenham Oaklands Junction

Scale (metres) 500 1000

slide-2
SLIDE 2

2

MINE AND QUARRY BLASTS

(In-plane) (Flexural)

Mine Blast Quarry Blast

Modes of Response

PROJECT OBJECTIVES

Compare effects of blasting with environmental loads Identify the relationship between the level of vibration and structural drift

  • Plasterboard (interior)

Establish the relationship between drift and damage of non- structural components

  • URM veneer (exterior)

Blasting Blasting

  • The vibrations travel through the ground in the form of

The vibrations travel through the ground in the form of surface and body waves which produce different particle surface and body waves which produce different particle motions in the soil motions in the soil

Subsurface Infrastructure Above Ground Structures

Blasting Blasting

  • The vibrations travel through the ground in the form of

The vibrations travel through the ground in the form of surface and body waves which produce different particle surface and body waves which produce different particle motions in the soil. motions in the soil.

Subsurface Infrastructure

Airblast

Ground Vibration

Above Ground Structures

Blast holes

slide-3
SLIDE 3

3

Propagation Direction

Ground Vibration Ground Vibration

  • Compressive Waves

Compressive Waves

  • Denoted as

Denoted as P P (Primary) they are the fastest type of (Primary) they are the fastest type of seismic wave. seismic wave.

  • Produce particle motion (vibrations) parallel to its

Produce particle motion (vibrations) parallel to its direction of travel. direction of travel.

Ground Vibration Ground Vibration

  • Shear Waves

Shear Waves

  • Denoted as

Denoted as S S (Secondary), are the second fastest (Secondary), are the second fastest type of seismic wave. type of seismic wave.

  • Produce particle motion (vibrations) perpendicular to

Produce particle motion (vibrations) perpendicular to its direction of travel. its direction of travel.

Ground Vibration Ground Vibration

Propagation direction

  • Rayleigh Waves

Rayleigh Waves

  • Rayleigh waves are slower however they tend to

Rayleigh waves are slower however they tend to cause more damage as their particle motion is cause more damage as their particle motion is greater. greater.

  • Produce a “elliptical” particle motion.

Produce a “elliptical” particle motion.

Peak Particle Velocity Peak Particle Velocity -

  • PPV

PPV

  • PPV is correlated

PPV is correlated to damage and to damage and human discomfort human discomfort. .

  • The intensity of a

The intensity of a blast is governed blast is governed by blast design by blast design and geological and geological conditions. conditions.

  • The peak particle velocity (PPV) is used to represent the

The peak particle velocity (PPV) is used to represent the intensity of ground vibration. intensity of ground vibration.

v t l p

V V V V + + =

slide-4
SLIDE 4

4

El Centro Earthquake 5mm/s Mine Blast 5mm/s Quarry Blast

~4sec. ~2sec. ~20-30sec.

BLAST CHARACTERISTICS

Typical blast vibrations

“humans are good detectors of vibrations but poor measuring devices”

50 40 30 20 10 1 10 40 100 Frequency (Hz)

Peak Particle Velocity (mm/s) USBM RI 8507 BS 7385-2 AS 2187.2-1993 ANZEC

VIBRATION STANDARDS VIBRATION STANDARDS STATIC TESTING (COMPLETED)

Mortar cube tests Prism tests Triplet tests Racking tests (x2) Bond wrench tests

slide-5
SLIDE 5

5

TEST HOUSE CONSTRUCTION

  • Timber frame
  • Plasterboard interior
  • 1.5T concrete roof mass
  • Additional bracing

Frame and Interior

  • GP veneer ties
  • 1:1:6 (C:L:S) mortar
  • 40mm cavity
  • 2.3m high masonry
  • 230x76x110mm extruded clay units

Veneer

  • 100x100x6mm EA lintels
  • 2.4m x 2.8m in plan

INSTRUMENTATION

Photogrammetry model

  • Total of 564 blasts
  • Range of intensity: 1 - 383mm/s
  • First in-plane cracking:
  • 140mm/s (walls with doors)
  • 300mm/s (walls with windows)
  • Other damage:
  • ties loosened at 85mm/s
  • flexural cracking at 140mm/s

Summary of Test

SHAKING TABLE TEST - RESULTS

370mm/s (East-West)

SHAKING TABLE TEST - RESULTS

slide-6
SLIDE 6

6

1/100 1/75 1/500 1/250

Key:

SW & NW uncracked SW & NW partially cracked SW fully cracked, NW partially cracked

NORTH & SOUTH MASONRY DRIFT

SWCA1, SWCB1, NWCB1, SWCC1 SWCA2, SWCA3, SWCC2, SWCD, NWCC SWCB2 NWCB2

Drift 1/100 1/500 1/250

EWCB WWCA1, WWCB1 EWCA WWCB2, WWCC

Key:

EW & WW uncracked EW cracked, WW uncracked EW & WW cracked EW completely cracked, WW partially cracked EW & WW fully cracked

EAST & WEST MASONRY DRIFT

Drift

SUMMARY OF DRIFT

1/870 1/750 1/750 1/700 Drift, Δth Threshold 1/860 East 1/370 South 1/390 West 1/760 North Drift, Δcr Wall Cracking Δ25mm/s / Δth Δ5mm/s / Δth AS2187.2 Vibration Limits Human comfort Structural damage Factor of resistance to cracking (absence of other loads) 33 7.7 2% 1% 3% 2% 6% 5% 12% 13% Maximum permissible deformation of brick veneer: L/600 (AS2870 Australian Residential Slabs and Footings Code)

CONCLUSIONS

A specimen representing a typical brick veneer house has been developed and subjected to simulated uniaxial ground vibrations The threshold drift for the onset of damage has been identified as

  • 1/870 for walls with doors
  • 1/750 for walls with windows

Maximum drift of the test house to vibrations at existing vibration limits was well below the drift at the onset of damage (less than 1/600 serviceability limit prescribed in AS2870 Residential Slabs and Footings code) 186mm/s discrepancy at first cracking between the two directions highlights the need for industry displacement based limits Parametric study in ANSYS (in progress) to further investigate influence of other geometries and material properties

slide-7
SLIDE 7

7

Typical blast vibrations

“humans are good detectors of vibrations but poor measuring devices”

50 40 30 20 10 1 10 40 100 Frequency (Hz)

Peak Particle Velocity (mm/s) USBM RI 8507 BS 7385-2 AS 2187.2-1993 ANZEC

VIBRATION STANDARDS

  • Terrock Consulting Engineers (project partner)
  • ARC linkage grant (No. LP0211407)

ACKNOWLEDGEMENTS

  • ACARP