overview
play

Overview FY19 budget was developed by the cost center leaders and - PowerPoint PPT Presentation

Overview FY19 budget was developed by the cost center leaders and the district leadership team and considered information learned from a listening tour of the district. Budget process has included input from School Committee about


  1. Overview •FY’19 budget was developed by the cost center leaders and the district leadership team and considered information learned from a “listening tour” of the district. •Budget process has included input from School Committee about the committee’s priorities. •The School Committee Chair, Superintendent, and Director of Business and Finance have participated with the Town in a budget steering process throughout the fall to ensure timely communication about the School Department’s needs. •Though original requests topped 6%, with district goals and other factors such as School Committee Proposed FY’19 Operating Budget class size guidelines in mind, the team identified priorities and made choices. •The proposed budget amply provides for the district’s needs, while leaving some “wishes” unfunded.
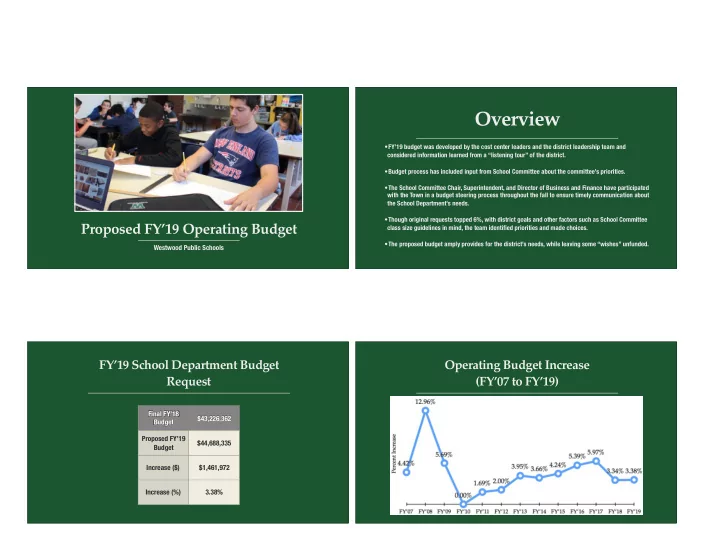
 Westwood Public Schools FY’19 School Department Budget Operating Budget Increase Request (FY’07 to FY’19) Final FY’18 $43,226,362 Budget Proposed FY’19 $44,688,335 Budget Increase ($) $1,461,972 Increase (%) 3.38%

  2. Major Budget Categories FY’19 Budget Highlights •3.38% increase over FY’18. Major Budget Category FY’18 Budget Proposed FY’19 Budget Incremental Change ($) Incremental Change (%) Total Salaries $37,150,299 $38,630,529 $1,480,230 3.98% •No cuts to programs or services. Special Education $1,089,216 $1,073,279 ($15,937) -1.46% (non-salary) •Contractual salary increased of $1,100,045. $1,432,650 $1,231,000 ($201,650) -14.08% Utilities Operations and Maintenance $918,376 $964,010 $45,634 4.97% •The addition of 8.75 FTE District-Wide (includes 5.6 FTE (non-salary) Special Education positions). All other non-salary $2,635,822 $2,789,517 $153,695 5.83% TOTAL $43,226,362 $44,688,335 $1,461,972 3.38% •Year 1 of a 2-year plan to eliminate the full-day kindergarten tuition fee. • Salaries are the largest budget driver, accounting for 86.5% of the total budget. District Enrollment Shifting District Enrollment

  3. Reallocate Staff Across District Due District Enrollment by Level to Shifting Enrollment (2.0 FTE) ($120,000) Elementary (Deerfield): Reduce 2 Teachers 1.0 FTE $60,000 High School: Add Science Teacher 1.0 FTE $60,000 High School: Add Teacher (Unallocated) (1.0 FTE) ($60,000) Elementary (Martha Jones): Reduce Teacher 1.0 FTE $60,000 Elementary (Downey): Add Kindergarten Teacher (1.0 FTE) ($24,000) Elementary (Hanlon): Reduce Class Size Aide 1.0 FTE $24,000 Elementary (Downey): Add Kindergarten Assistant 0.0 FTE $0.00 TOTAL High School Enrollment FY’19 Staffing Requests

  4. High School Class Size (2017-2018) High School Staffing Requests 20% of classes at the High School have 25 or more students 25-29 Students Department % of Sections Number of within •1.0 FTE High School Science — $60,000 Sections Department Art 1 5.6% •Lower class sizes and continue to support electives in Computer Science, Engineering, Marine Biology, and English 10 17.9% Environmental Science & Ecology. Foreign Lang 2 4.0% •1.0 FTE Yet-to-be-Allocated— $60,000 Math 13 25.5% •Mitigating rising class sizes in multiple departments. Science 19 33.3% Position will be allocated after course selections. Social Studies 11 21.2% Totals 56 19.7% Middle School Enrollment Middle School Staffing •Over the last several years, as enrollment has increased at Thurston, numerous positions were added in both core academics and the arts. •Enrollment has plateaued and will begin to decrease. •Thurston is well-staffed for current needs. •Have added programs and continue to invest in curriculum materials.

  5. Projected Elementary Enrollment (2018-2019) Enrollment by Elementary School Martha Grade Deerfield Downey Hanlon Sheehan Jones Total Kindergarten 19 18 19 17 16 10 Kindergarten Kindergarten 18 17 16 175 9 Grade 1 Kindergarten 18 17 K/1 19 19 2016-2017 2017-2018 2018-2019 Grade 1 19 23 18 17 19 193 Grade 1 24 19 17 19 Grade 1 18 Deerfield 226 201 172 Grade 2 14 22 15 20 15 Grade 2 15 23 16 21 15 191 Grade 2 15 Downey 244 255 276 Grade 3 16 21 18 15 18 Grade 3 17 21 18 16 18 212 Grade 3 16 18 Hanlon 219 220 222 Grade 4 21 21 19 24 23 Grade 4 22 21 19 25 23 241 Martha Grade 4 23 295 294 273 Jones Grade 5 14 23 21 16 17 Grade 5 15 23 21 17 17 218 Sheehan 343 318 306 Grade 5 17 17 Total 172 276 222 273 306 Elementary Staffing Requests Elementary Staffing Requests Several staffing changes (additions or reductions) are due to changes in enrollment •Add 1.0 FTE Classroom Teacher at Downey — $60,000 and to address class sizes. •Though Downey currently has 2 kindergartens, we anticipated needing 3 •Decrease 2.0 FTE Classroom Teachers at Deerfield — ($120,000) kindergarten classroom next year (54 students) •“Graduating” three Gr. 5 classes; only one incoming kindergarten •Add 1.0 FTE Kindergarten Assistant at Downey — $24,000 •Decrease 1.0 FTE Class Teacher at Martha Jones — ($60,000) •Add 2.0 FTE Literacy Paraprofessionals at Downey — $56,000 •“Graduating” three Gr. 5 classes; only two incoming kindergartens •Next year’s grade 1 classes are projected above guideline at 24 and 23. These positions would provide additional support to those classes. •Decrease 1.0 FTE Paraprofessional at Hanlon — ($24,000) •Add .1 FTE Math Specialist at Hanlon — $6,000 •Current Gr. 5 with 26 students has a class size aide; next year’s classes within guideline. •This small increase will bring the math specialist at Hanlon to full-time.

  6. Elementary Staffing Requests Central Office Staffing • Decrease 0.4 FTE Central Office Staffing — ($40,700) Two elementary staffing requests are related to district goals and priorities. •Add 1.0 ABA Tutor District-wide — $30,000 • Reflects a change in the responsibilities of the District •Based at Sheehan Professional Development Coordinator •Working under supervision of district’s BCBAs •Used flexibly to provide coaching and training to general education teachers who are implementing parts of student behavior plans. •Responding to an articulated need from teachers for Social Emotional Learning supports. •Add Part-Time (10 hours/week) Science Materials Manager — $10,686 •Support teachers by tracking inventory, prepare and transports science and engineering materials through district to support units of instruction. Budget Drivers in Special Special Education Staffing Education The following requests support the program expansion of the Westwood SPED Tuition FY’18 FY’19 Difference Applied Behavioral Analysis Program (WABA). The positions will allow us to: $213,218 $227,005 $13,787 Residential Tuition • Split program into Lower WABA (PreK-2) and Upper WABA (Gr. 3-5). $909,662 $644,186 ($265,476) Day Tuition • Accommodate increased number of students in the program. Collaborative Tuition $334,552 $503,790 $169,238 • Provide appropriate caseloads and space. Out-of-District SPED $452,179 $445,791 ($6,388) Transportation • Meet DESE regulation around age/grade spans. $281,829 $281,829 $0 In-District SPED Transportation • Educate students in their community rather than out-of-district in an $2,191,440 $2,102,601 ($88,839) Total educationally sound and financially responsible model.

  7. Special Education Staffing Special Education Staffing • 0.4 FTE Instructional Assistant (Elementary) — $11,200 The following positions are needed to create a Lower WABA/Upper WABA model: • Add 1.0 FTE Intensive Special Education/BCBA Teacher — $60,000 • To allow for service delivery requirements to be met. • Add 3.0 ABA Tutors — $90,000 • 0.6 FTE Speech and Language Therapist (High School) — • Add 0.4 FTE Augmentative Communication Speech and Language Therapist $36,000 — $24,000 • Related to enrollment increase at High School, the need to • Add 0.2 FTE Occupational Therapist — $12,000 meet service delivery requirements for rising grade 8 to 9 students, and existing WHS students with communication The cost of these positions is partially offset by reductions in out-of-district disabilities whose IEPs afford access to public education tuition and special education transportation costs. through age 22. Kindergarten T uition Reduction Non-Salary Accounts • Year 1 of a 2-year plan to eliminate the kindergarten tuition fee. • The net change in non-salary accounts is (-$18.258), reflecting additions, reductions, and reallocations in line items. • Tuition is currently $1,800/year. • Additions to Budget: • Online science, technology, and engineering curriculum resources — $15,000 • In the 2018-2019 school year, kindergarten tuition will be $900/ • Annual Writer’s Conference at Thurston — $4,200 year. • Restore Professional Development Funding — $20,000 • In 2019-2020 there will be no fee. • Increase Special Education Contracted Services — $25,000 • Impact to the FY’19 Budget: An $85,000 reduction to the • Certified Nursing Assistant due to increase medical support needs for students with significant disabilities who are staying in-district (gr. 9-12) kindergarten tuition offset or a 0.2% increase to the operating budget. • A reduction in the Circuit Breaker Offset — $27,902

Download Presentation
Download Policy: The content available on the website is offered to you 'AS IS' for your personal information and use only. It cannot be commercialized, licensed, or distributed on other websites without prior consent from the author. To download a presentation, simply click this link. If you encounter any difficulties during the download process, it's possible that the publisher has removed the file from their server.

Recommend


More recommend