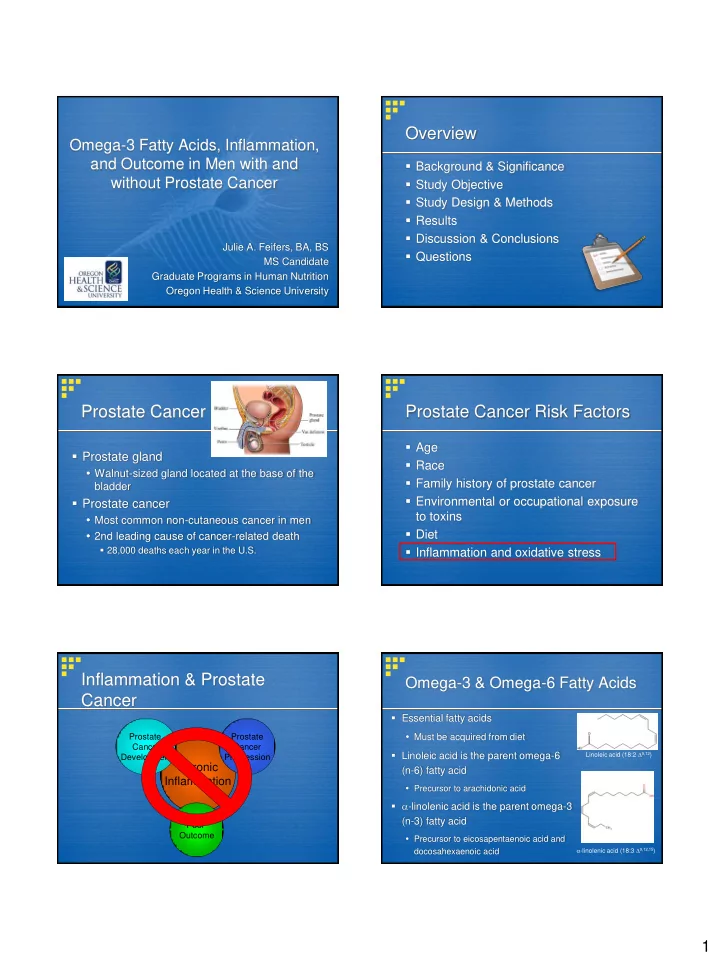
overview
play

Overview Omega-3 Fatty Acids, Inflammation, and Outcome in Men with - PDF document

Overview Omega-3 Fatty Acids, Inflammation, and Outcome in Men with and Background & Significance without Prostate Cancer Study Objective Study Design & Methods Results Discussion & Conclusions Julie A. Feifers,


  1. Overview Omega-3 Fatty Acids, Inflammation, and Outcome in Men with and  Background & Significance without Prostate Cancer  Study Objective  Study Design & Methods  Results  Discussion & Conclusions Julie A. Feifers, BA, BS  Questions MS Candidate Graduate Programs in Human Nutrition Oregon Health & Science University Prostate Cancer Prostate Cancer Risk Factors  Age  Prostate gland  Race  Walnut-sized gland located at the base of the  Family history of prostate cancer bladder  Environmental or occupational exposure  Prostate cancer to toxins  Most common non-cutaneous cancer in men  Diet  2nd leading cause of cancer-related death  28,000 deaths each year in the U.S.  Inflammation and oxidative stress Inflammation & Prostate Omega-3 & Omega-6 Fatty Acids Cancer  Essential fatty acids  Must be acquired from diet Prostate Prostate Cancer Cancer  Linoleic acid is the parent omega-6 Linoleic acid (18:2  9,12 ) Development Progression Chronic Acute (n-6) fatty acid Inflammation Inflammation  Precursor to arachidonic acid   -linolenic acid is the parent omega-3 (n-3) fatty acid Poor Outcome  Precursor to eicosapentaenoic acid and  -linolenic acid (18:3  9,12,15 ) docosahexaenoic acid 1

  2. Omega-3 Fatty Acids & Inflammation Study Objective  The purpose of this study was to investigate the relationship between inflammation and outcome in biopsy negative controls and prostate cancer cases as well as the modification of that relationship by omega-3 fatty acids. Calder et al., 2006 Study Design  Prospective cohort study based on baseline data from a case-control study  Secondary analysis of The Diet and Prostate Cancer (DPC) Study  Case-control study conducted at the Portland Veteran Affairs Medical Center (PVAMC) from December 2001 through August 2006  Subjects Study Design & Methods  240 biopsy negative controls  121 prostate cancer cases Methods: Outcome Data Methods: Tissue & Plasma Analysis  Prostate tissue analysis  Assessment of outcome  Inflammation measured by IHC on biopsy tissue from  Collected from the DPC longitudinal database and biopsy negative controls PVAMC CPRS charting system  Plasma analysis  Outcome of interest  Inflammatory markers: IL-6 and CRP  Interleukin-6 analyzed using ELISA  Incident prostate cancer in biopsy negative controls  C-reactive protein analyzed using Immulite  Biochemical recurrence after localized treatment in  Erythrocyte fatty acid analysis (ALA, DHA, EPA) prostate cancer cases  Expressed as % of total fatty acids  Conducted using GC/MS 2

  3. Results: Descriptive Stratification by Gleason Statistics Score  Gleason score (GS)  Relatively homogenous population  Significant difference in education, age-adjusted  Grading system for prostate cancer based on Charlson score, and prostate volume at the time of microscopic inspection of the malignant tissue initial biopsy  Sum of the most and second dominant Gleason  No significant difference in n-3 fatty acids or pattern plasma inflammatory markers between  Ranges from 2-10, with 10 being the most controls and cancer cases aggressive  ALA significantly lower in low-grade cancer cases  GS used to define low-grade and high- compared to controls grade cancer for this study  IL-6 significantly higher in high-grade cancer cases compared to controls Correlations after Stratification by Cancer Status Table 5. Pearson's correlation coefficients of plasma markers of inflammation and Table 6. Pearson's correlation coefficients erythrocyte fatty acids in biopsy negative of plasma markers of inflammation and controls* erythrocyte fatty acids in cancer cases* IL-6 CRP IL-6 CRP IL-6 IL-6 0.471 a 0.252 a CRP CRP ALA 0.015 0.080 ALA -0.031 -0.031 Results: Correlations between -0.149 b -0.246 d DHA DHA 0.016 -0.025 EPA -0.137 c -0.112 EPA -0.061 -0.026 Plasma Markers of Inflammation & a p <0.005 a p <0.001, b p = 0.021, c p = 0.034, d p <0.001 *IL-6, CRP, ALA, DHA, EPA were logarithmically *IL-6, CRP, ALA, DHA, EPA were logarithmically transformed transformed N-3 Fatty Acids Biopsy Negative Prostate Cancer Controls Cases Inflammation, N-3 Fatty Acids, & Prostate Cancer Risk  In men with CRP levels in the middle category:  Significant increased risk of prostate cancer with lower levels of ALA  Significant increased risk of prostate cancer with Results: Inflammation, N-3 higher levels of DHA  Significant decreased risk of high-grade prostate Fatty Acids, and Prostate cancer with lower levels of DHA Cancer Risk 3

  4. Outcome for Biopsy Negative Controls Table 11. Incident of prostate cancer and mortality in biopsy negative controls as of June 1, 2008. Controls (n = 240) Outcome a n (%) Had Repeat Biopsies 99 (41.3) Developed Prostate Cancer b 17 (7.1) Deceased 10 (4.0) a Median f ollow-up time in months (range): 51.5 (3.0 - 78.0) b Includes subject who dev eloped prostate cancer bef ore June 1, 2008 and no less than 6 months af ter their initial biopsy Results: Patient Outcome  Median follow-up time was 51.5 months  Median time to incident of prostate cancer was 27 months Inflammation, N-3 Fatty Acids, & Prostate Carcinogenesis  Significant increased risk of developing prostate cancer in men with higher levels of EPA  Significant increased risk also observed in men with higher levels of EPA and increasing levels of CRP Results: Inflammation, N-3 Fatty Peto-Peto test p-value = 0.03 log-rank test p-value = 0.03 Acids, & Prostate Carcinogenesis Systemic Inflammation & Prostate Tissue Inflammation Table 14. IL-6 and CRP plasma levels in biopsy negative controls with and without prostate tissue inflammation at the time of initial biopsy Prostate Tissue Inflammation Present Not Present p a (n = 114) (n = 126) median (range) IL-6 (pg/mL) 1.99 (0.54 - 26.3) 1.69 (0.64 - 22.7) 0.038 Results: Systemic Inflammation & CRP (mg/L) 1.70 (<0.3 - 29.6) 1.20 (<0.3 - 42.6) 0.047 Prostate Tissue Inflammation a Wilcoxon rank sum test 4

  5. Systemic Inflammation & Discussion Prostate Tissue Inflammation Table 15. Odds of prostate tissue inflammation in biopsy  Inverse relationship between systemic negative controls inflammation and n-3 fatty acids (DHA & Age-adjusted No. with EPA) was only observed in men without inflammation/ 95% no. without Odds Confidence prostate cancer inflammation Ratio Interval (114/126)  Why? IL-6 (pg/mL)  Cancer may causes cellular changes < 1.50 26/54 1.00 Referent 1.50 < 2.33 44/35 2.61 a 1.37, 4.97  Membrane fatty acid composition ³ 2.33 2.46 b 44/35 1.29, 4.70 p Trend 0.007  Enzyme function p Effect 0.004 CRP (mg/L)  Metabolic pathways < 3 86/100 1.00 Referent 3 < 10 19/20 1.1 0.55, 2.20 ³ 10 9/6 1.74 0.59, 5.13 p Trend 0.35 p Effect 0.59 b Significantly different from reference group (Wald Test p-value = 0.004) d Significantly different from reference group (Wald Test p-value = 0.006) Discussion Conclusions  Higher intakes of n-3 fatty acids may reduce systemic  Relationship between n-3 fatty acids and inflammation in men without prostate cancer prostate cancer risk has not been  Systemic inflammation may indicate inflammation in consistently described by previous research the prostate  Possible reasons for discrepancies  More research needed to validate these results  Genetic variations  Further research focused on the relationship between n-3 fatty acids and prostate cancer is needed  Relationship between n-3 and n-6 fatty acids  Research should be conducted in populations with  Dietary levels of n-3 fatty acids adequate DHA and EPA levels or in conjunction with supplementation Questions Dietary Recommendations  Dietary Reference Intake  ALA  1.1 g/day for women  1.6 g/day for men  American Heart Association  Normal adults  Consume fish 2x/week  Adults with CHD  1 g/day EPA+DHA  Adults with elevated triglycerides  2 - 4 g/day EPA+DHA 5

  6. Dietary Exposures & Cancer Risk U.S. exposure to high n-3 fatty acids Proposed dose response Cancer Incidence association between dietary exposures and cancer risk. Rate McMichael A, Potter J. JNCI 1985 low high N-3 Fatty Acid Exposure 6

Download Presentation
Download Policy: The content available on the website is offered to you 'AS IS' for your personal information and use only. It cannot be commercialized, licensed, or distributed on other websites without prior consent from the author. To download a presentation, simply click this link. If you encounter any difficulties during the download process, it's possible that the publisher has removed the file from their server.

Recommend


More recommend